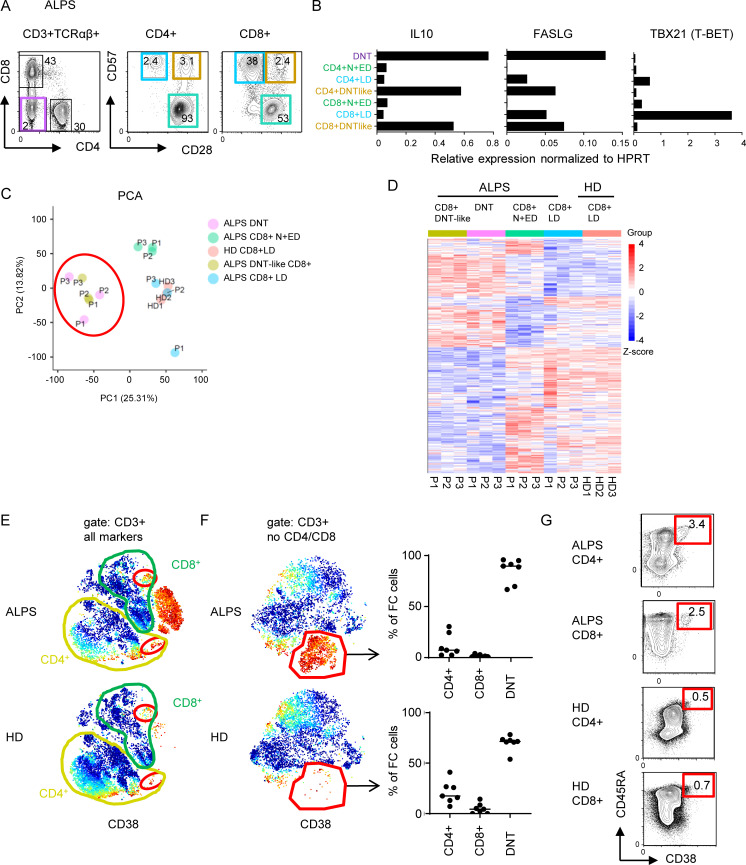
Figure 5.
The FC T cell signature can be found among CD4+ and CD8+ T cells. (A) Sorting strategy for ALPS DNTs, CD4+CD28+CD57− N+EDs, CD4+CD28−CD57+ LDs, CD4+CD28+CD57+ (ALPS DNT-like CD4+), and the respective CD8+ T cell subsets for quantitative RT-PCR and/or RNA sequencing. (B) Expression levels of IL10, FASLG, and TBX21 (T-BET) in indicated T cell subsets of one ALPS-FAS patient (P1). Expression was normalized to HPRT. (C) Principal component (PC) analysis (PCA) of RNA sequencing data on DNTs, CD8+ N+EDs, CD8+ LDs, and DNT-like CD8+ of three ALPS-FAS patients (P1–P3) and CD8+ LDs of three HDs (HD1–HD3). (D) Heatmap of all genes differentially expressed (adjusted P < 0.05) in any comparison are shown for all analyzed subsets. The relative expression (Z-score) of genes is shown and color coded according to the legend. Rows are scaled to have a mean value of 0 and an SD of 1. (E) Example t-SNE plots showing all T cells and CD38 expression for one ALPS-FAS patient and one HD. Small populations among CD4+ and CD8+ T cells resembling FC DNTs are highlighted with red gates. Similar results were seen in all seven ALPS patients and all seven HDs. (F) t-SNE visualization of all T cells without CD4 and CD8 lineage markers. Example plots for one ALPS-FAS patient and one HD are shown with CD38 expression. The FC population was manually gated. Percentages of CD4+, CD8+, and DNTs within the FC cluster shown for all ALPS patients (n = 7) and all HDs (n = 7). Lines indicate medians. (G) Example plots with gating and percentages of FC CD4+ of total CD4+ and FC CD8+ of total CD8+ T cells determined by flow cytometry. Similar results were obtained in another 13 ALPS-FAS patients and 54 controls (Fig. S3 and data not shown).

