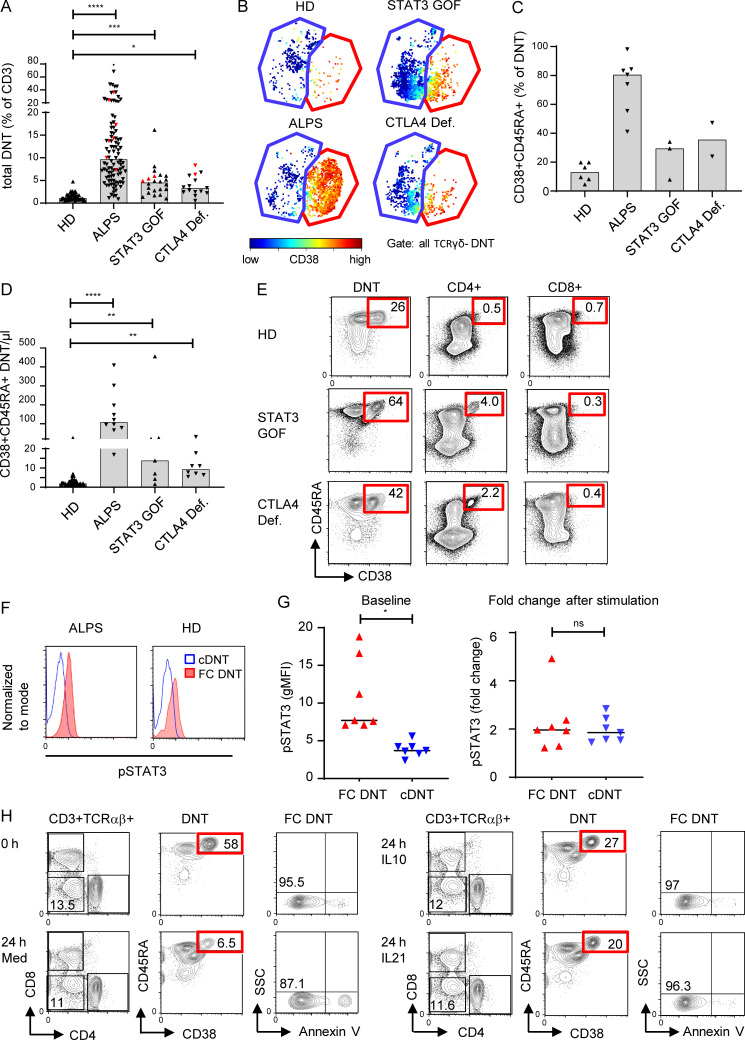
Figure 8.
FC DNTs are regulated by CTLA4 and STAT3. (A) Percentages of total TCRαβ+ DNTs in whole blood of HDs and indicated disease groups (ALPS, n = 99; STAT3 GOF, n = 22; CTLA4 deficiency [Def.], n = 15). Values of patients included in the CyTOF analysis are highlighted with red symbols (ALPS, n = 7; STAT3 GOF, n = 3; CTLA4 Def., n = 2). Columns indicate median values. Statistical comparisons were performed using the Kruskal-Wallis test. *, P < 0.05; ***, P < 0.001; ****, P < 0.0001. (B) Example t-SNE plots of all DNT (CD3+TCRγδ−) showing FC DNTs (red gate) and cDNTs (blue gate) and corresponding CD38 expression for indicated patient groups. (C) Percentages of FC DNTs among total DNTs as determined by CyTOF for the indicated patient groups. Columns indicate mean values. (D) Absolute numbers of FC DNTs according to CD38/CD45RA expression in whole blood are depicted for indicated patient groups (ALPS, n = 10; STAT3 GOF, n = 7; CTLA4 Def., n = 8). Columns indicate median values. Statistical comparisons were performed using the Kruskal-Wallis test. **, P < 0.01; ****, P < 0.0001. (E) Example plots showing percentages of CD38+CD45RA+ FC T cells among total TCRαβ+ DNTs and CD4+ and CD8+ T cells by flow cytometry in indicated disease groups. Similar results were obtained in 10 HDs, 3 patients with STAT3 GOF, and 3 patients with CTLA4 Def. (F) Representative histograms showing pSTAT3 in FC DNTs and cDNTs of one ALPS patient and one HD. Comparable results were obtained for six additional ALPS patients. (G) Summary plots showing baseline geometric mean fluorescence intensity (gMFI) levels for pSTAT3 in FC DNTs and cDNTs (left) and fold changes of pSTAT3 after stimulation with IL-21 (right) in cells of seven HDs. Statistical comparisons were performed using the Wilcoxon test. ns, not significant; *, P < 0.05. (H) Flow cytometry plots showing percentages of viable (annexin V−) FC DNTs of one ALPS patient at day 0 and after 24 h of stimulation with medium alone or with medium supplemented with IL-10 or IL-21. Data were generated in five to nine ALPS patients with similar results (Fig. S5 E). SSC, side scatter.

