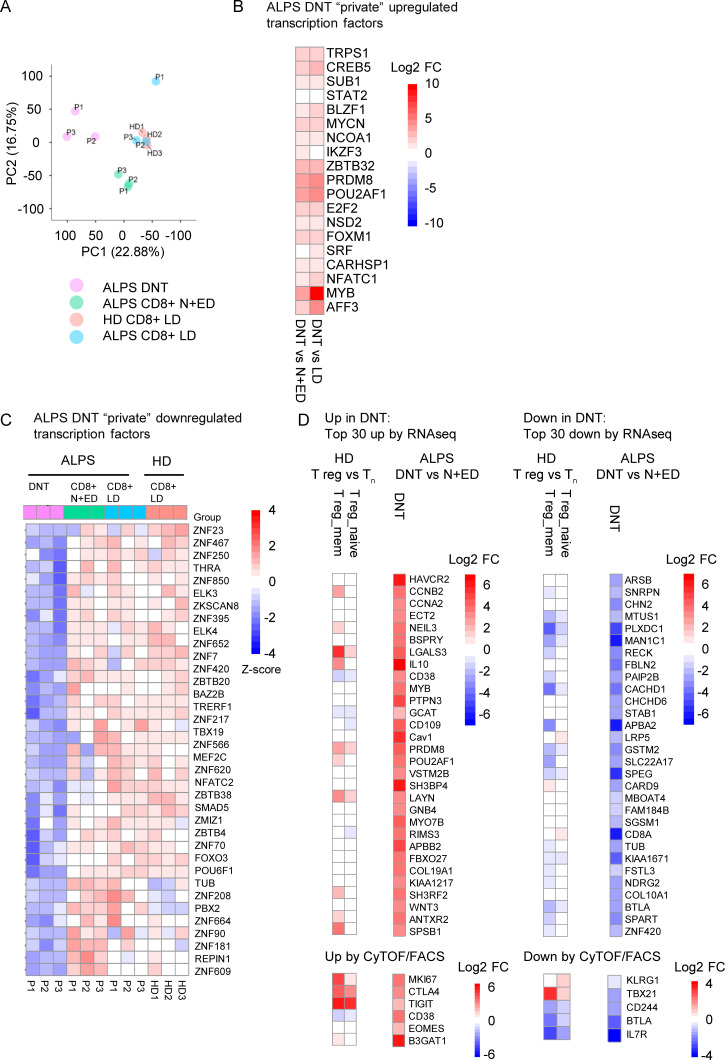
Figure S1.
ALPS DNTs show a unique transcriptional profile. (A) Principal component (PC) analysis of RNA sequencing data on DNTs, CD8+ N+EDs, and CD8+ LDs of three ALPS-FAS patients (P1–P3) and CD8+ LDs of three adult HDs (HD1–HD3). (B) Heatmap depicting up-regulated transcription factors among DNT private DEGs (all significantly up-regulated in both comparisons of DNTs versus CD8+ N+EDs and DNTs versus CD8+ LDs). Log2 fold changes (log2 FCs) are shown for the comparisons of DNTs versus CD8+ N+EDs and DNTs versus CD8+ LDs to compare the degree of dysregulation. (C) Heatmap of down-regulated transcription factors among DNT private DEGs (all significantly down-regulated in both comparisons of DNTs versus CD8+ N+EDs and DNTs versus CD8+ LDs). Relative expression (Z-score) of genes is shown and is color coded according to the legend. Rows are scaled to have a mean value of 0 and an SD of 1. (D) Heatmaps showing expression levels (color code = log2 FC) of the top 30 up- or down-regulated genes identified in ALPS DNTs versus CD8+ N+EDs and CD8+ LDs by RNA sequencing analysis (RNAseq) or selected up- or down-regulated molecules on ALPS DNTs by CyTOF/FACS in human naive T reg cells (T reg_naive = CD3+CD4+CD25hiCD127lowCD45RA+) and memory T reg cells (T reg_mem = CD3+CD4+CD25hiCD127lowCD45RA−) compared with naive CD4+ T cells (Tn = CD3+CD4+CD45RA+CCR7+). Tn, T naive.

