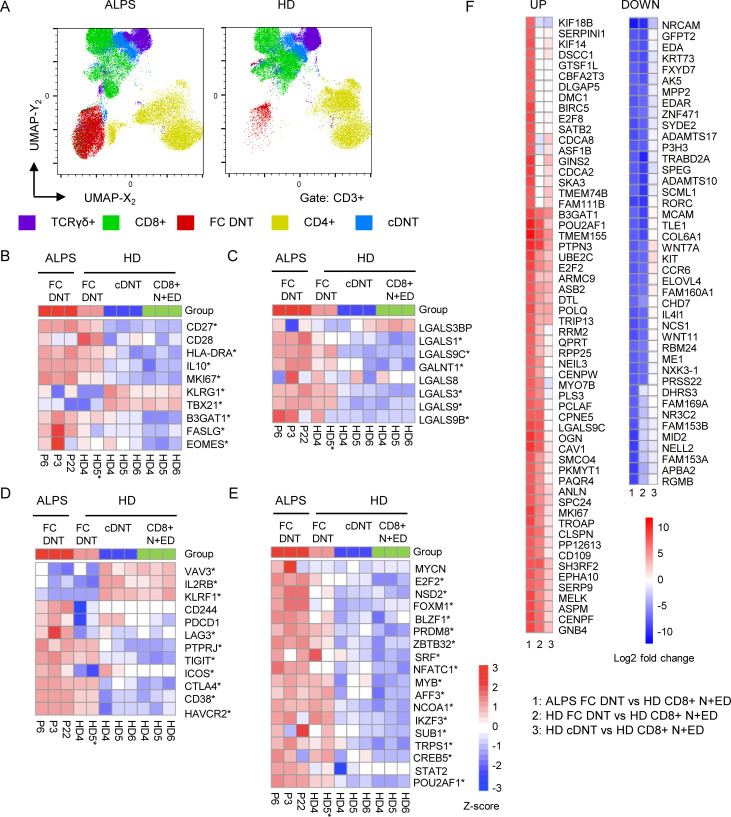
Figure S2.
ALPS patients and HDs have two main DNT clusters. (A) UMAP projection of indicated T cell populations in seven ALPS-FAS patients and seven HDs. (B) Heatmap comparing transcript levels of genes known to be dysregulated in ALPS DNTs in sorted ALPS FC DNT, HD FC DNT, HD cDNT, and HD N+ED CD8+ T cells. Cells were sorted from ALPS patients P3, P6, and P22 and from HD4, HD5, and HD6. For one HD FC DNT sample, RNA was pooled from four HDs to achieve sufficient RNA (HD5*). * indicates that a gene was significantly (adjusted P < 0.05) dysregulated compared with the reference HD CD8+ N+ED population. (C) Heatmap of selected genes coding for lectins or enzymes involved in glycosylation. (D) Heatmap of selected genes involved in T cell activation or differentiation. (E) Heatmap of up-regulated transcription factors found among ALPS DNT private DEGs in the first RNA sequencing analysis. For all heatmaps, the relative expression (Z-score) of genes is shown and is color coded according to the legend. Rows are scaled to have a mean value of 0 and an SD of 1. (F) Top 100 up- and down-regulated genes based on log2 fold changes in ALPS FC DNTs versus HD CD8+ N+EDs. Color code indicates log2 fold changes for the indicated comparisons (1, 2, or 3).

