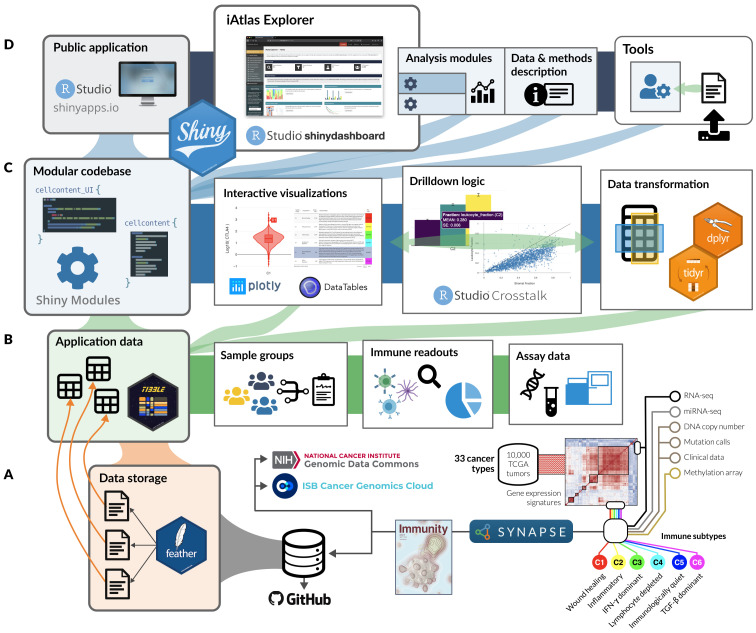
Figure 1. iAtlas architecture overview.
( A) Structured data from immunogenomic analyses, including the Immune Landscape 6 study and expanding over time, are organized and stored as flat (i.e., feather) files within Synapse and made available alongside the application code in GitHub. ( B) Tabular data from feather files are read from disk into memory to drive all operations related to sample groupings, sample-level immune characterizations (readouts), and more granular—and high dimensional—assay measurements. ( C) The core application code is built as a catalog of Shiny Modules, each of which encapsulates logic for data transformation and visualization related to a scientific theme or assay type. ( D) Analysis modules, tools, and data description views are hosted in a unified application on shinyapps.io; the layout and connectivity between modules in the iAtlas Explorer space are managed by the shinydashboard 21 library.

