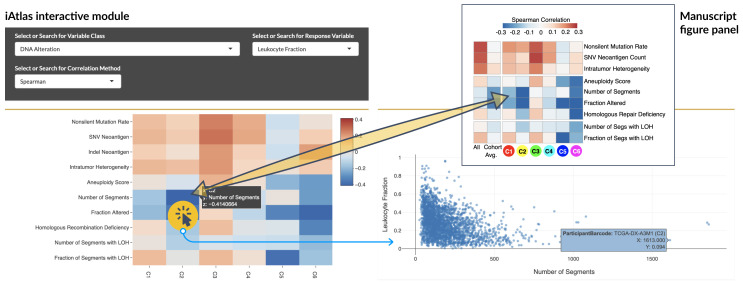
Figure 3. Visualization of the correlation of DNA damage in cancer with the degree of immune cell infiltration.
Top right: Original manuscript figure panel from the Immune Landscape 6study. Bottom left: Equivalent figure generated in iAtlas. By selecting a specific heatmap cell (highlighted), the underlying data is displayed ( Bottom right), using the selections shown. Individual points can be selected to get sample IDs and additional information (blue box).

