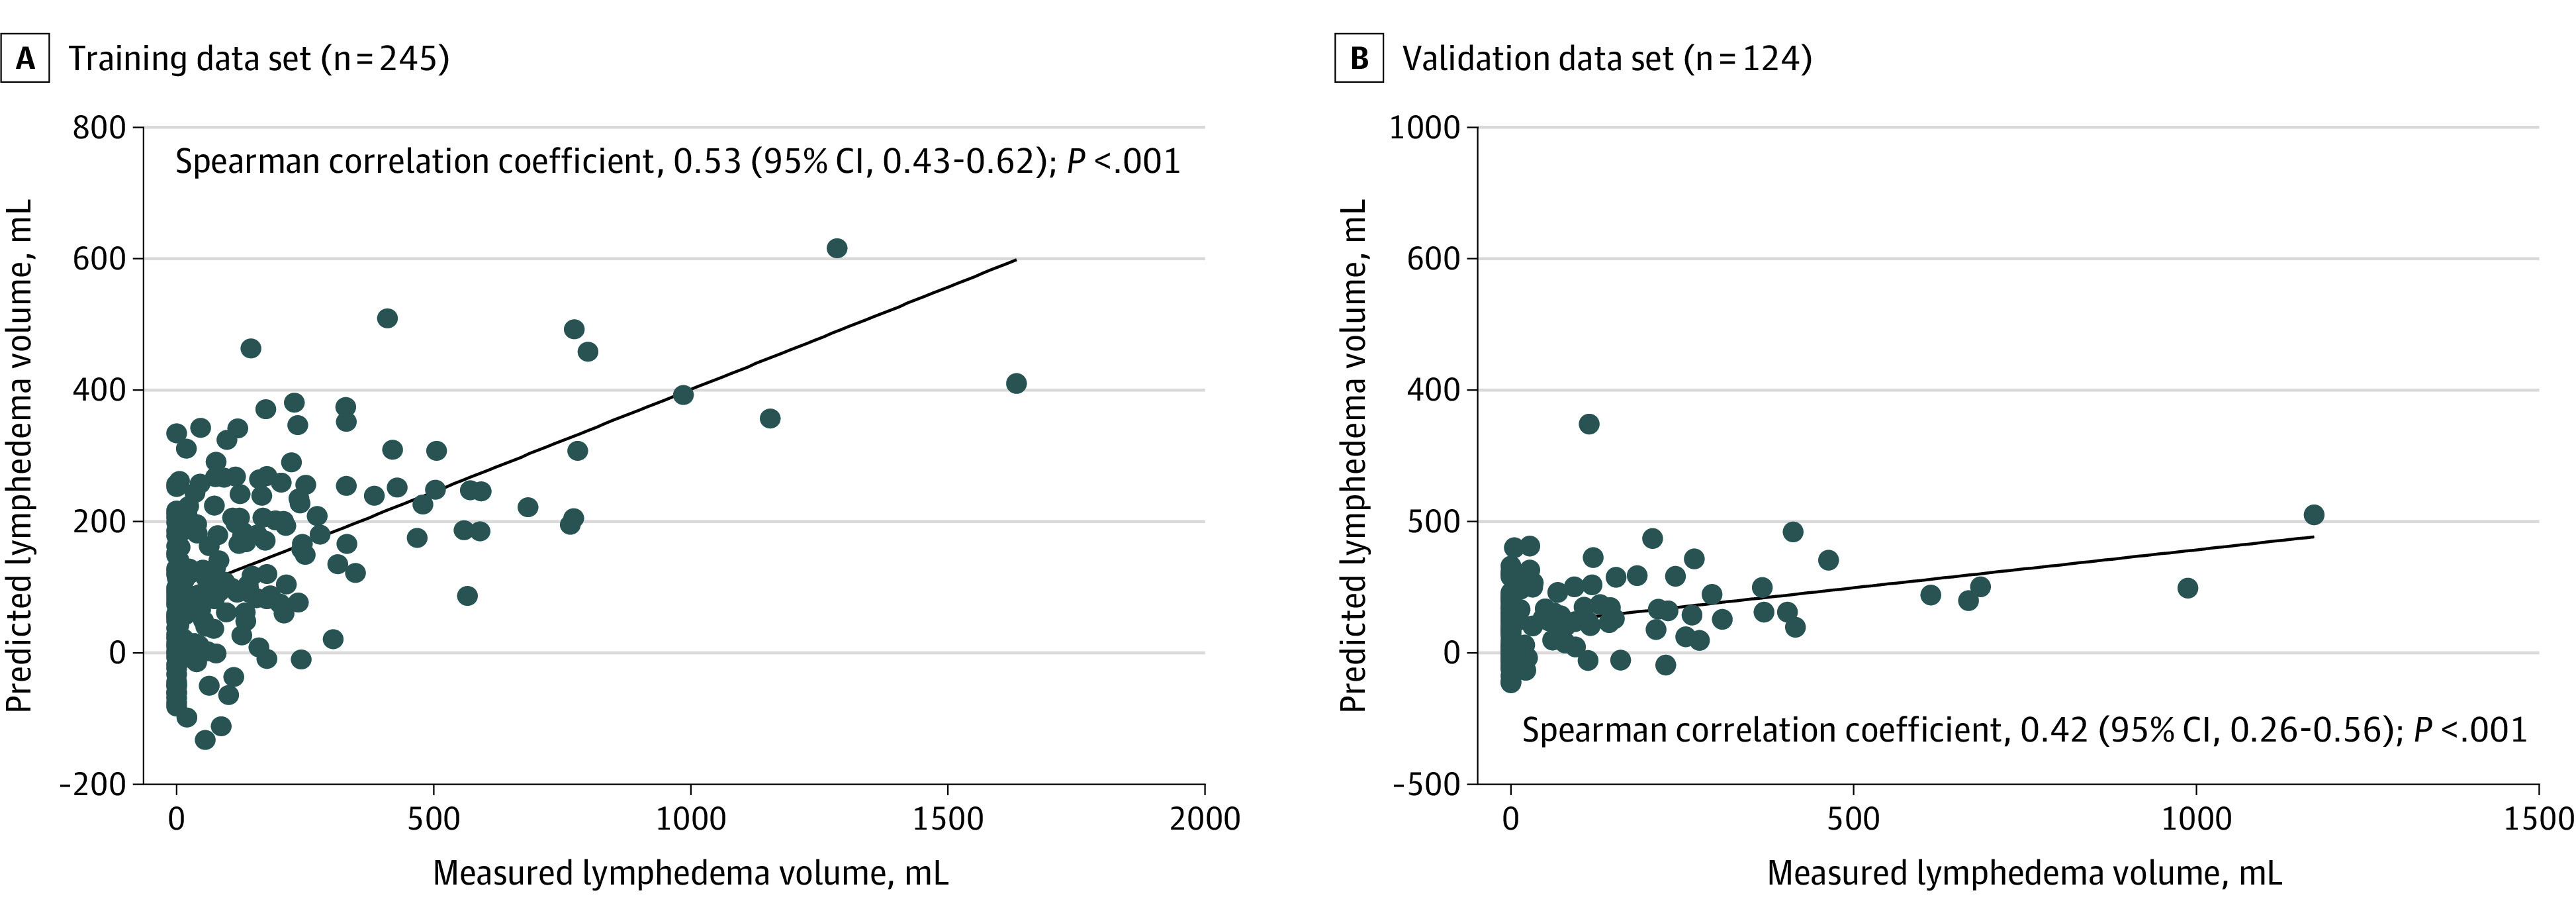
Figure 2. Correlation Between Measured and Predicted Lymphedema Volume.

Simple linear regression analysis was applied to generate a line of best fit. Two patients from each of the training and validation data sets were excluded because of missing number of pathological lymph nodes.
