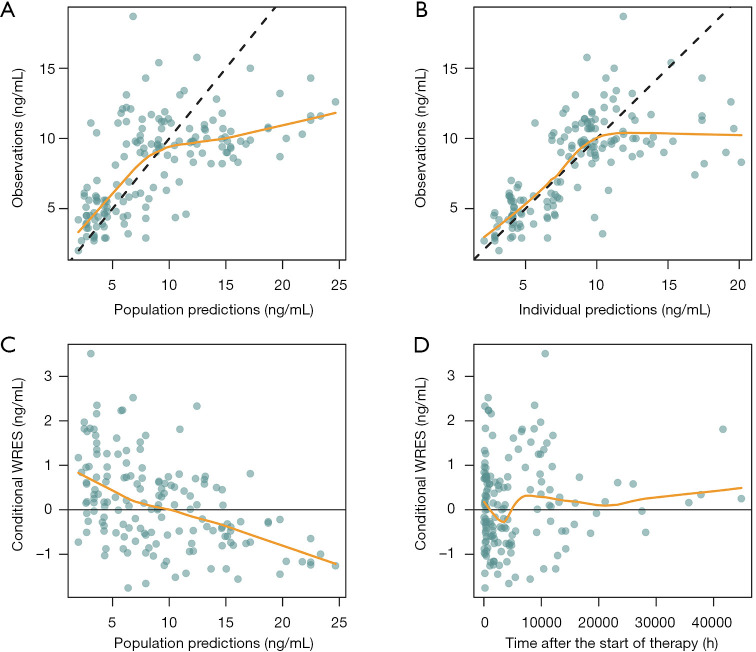
Figure 1.
Goodness-of-fit plots from the final population model. (A) Observations vs. population predictions; (B) observations vs. individual predictions; (C) conditional WRES vs. population predictions; (D) conditional WRES vs. time after the start of therapy. Partial concentration values were collected in previous studies (23,24). WRES, weighted residuals.

