
Figure 1.
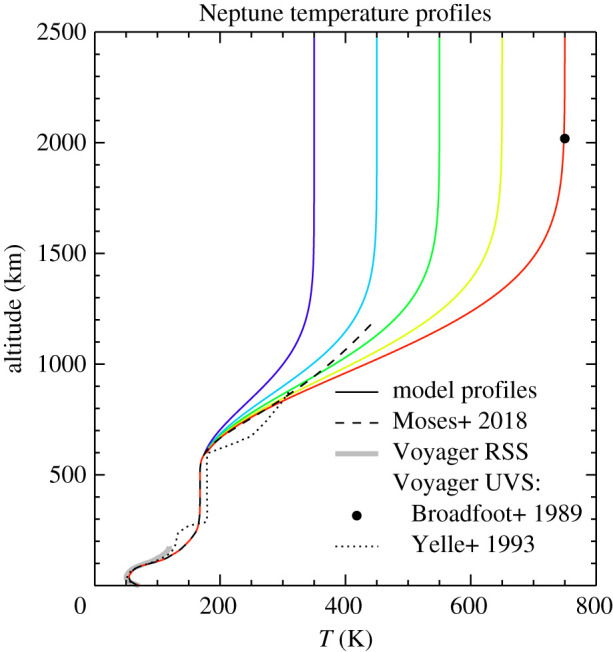
Coloured solid lines represent variations in thermal structure explored in this study. The red is the reference atmospherebased on infrared observations [42], combined in Moses et al. [43], and Voyager 2 constraints from its 1989 flyby [12,13], with various aspects of the Voyager data indicated by the grey shaded and dotted lines, and the filled circle. (Online version in colour.)