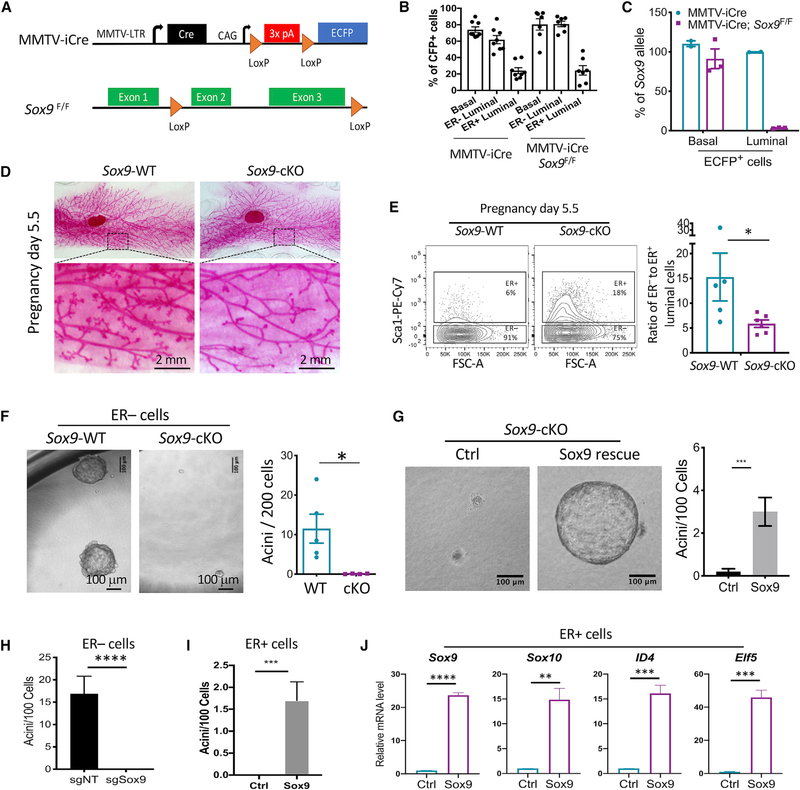
Figure 1. Sox9 Deletion In Vivo Inhibits ER− Luminal Stem/Progenitor Activity.
(A) Schematic of mouse models.
(B) MMTV-iCre activity in mammary epithelial cell subpopulations, based on the ECFP reporter. Mean ± SEM (n = 7–8 per group).
(C) Sox9 allele frequency in ECFP+ basal or luminal cells of indicated animals. Genomic DNA of fluorescence-activated cell sorting (FACS)-sorted cells was analyzed by qPCR. Mean ± SEM (n = 2–3 per group).
(D) Representative whole-mount carmine stain of pregnancy day 5.5 mammary glands of Sox9-WT (Sox9 F/F,n= 6) or Sox9-cKO (MMTV-iCre; Sox9 F/F,n= 8) mice. Mean ± SEM.
(E) Ratio of ER− to ER+ luminal cells at pregnancy day 5.5 as determined by flow cytometry. Mean ± SEM (n = 5–6 per group). *p < 0.05.
(F) Acinus-forming ability of ECFP+ ER− luminal cells sorted from Sox9-WT (MMTV-iCre) or Sox9-cKO (MMTV-iCre; Sox9F/F) mice at 2–3 months. Mean ± SEM (n = 4–5 per group). *p < 0.05.
(G) Acinus-forming ability of ECFP+ ER− luminal cells from MMTV-iCre; Sox9F/F mice transduced with the Sox9-expressing or control lentiviral vector. Freshly FACS-sorted cells were transduced in organoid culture, puromycin selected, and then reseeded for measuring acinus-forming ability. Representative results of two experiments are shown. Mean ± SEM ***p < 0.001.
(H) Acinus-forming capability of Sox9-WT ER- luminal cells transduced with the indicated sgRNA lentiviral vectors. Cells were transduced in organoid culture, selected with puromycin, and then re-seeded for measuring organoid-forming ability. Representative results of three experiments are shown. Mean ± SEM ****p < 0.0001.
I) Acinus-forming ability of Sox9-WT ER+ luminal cells transduced with the Sox9 or control lentiviral vector. Cells were transduced in adherent culture, selected with puromycin, and then reseeded in organoid culture 3 days post-transduction. Representative results of two experiments are shown. Mean ± SEM. ***p < 0.001.
(J) Expression levels of ER− luminal transcription factors in ER+ luminal cells transduced by the Sox9-expressing or control vector as done in (I). Cells were analyzed by qRT-PCR 3 days post-transduction. Representative results of two experiments are shown. Mean ± SEM. **p < 0.01, ***p < 0.001, ****p < 0.0001.

