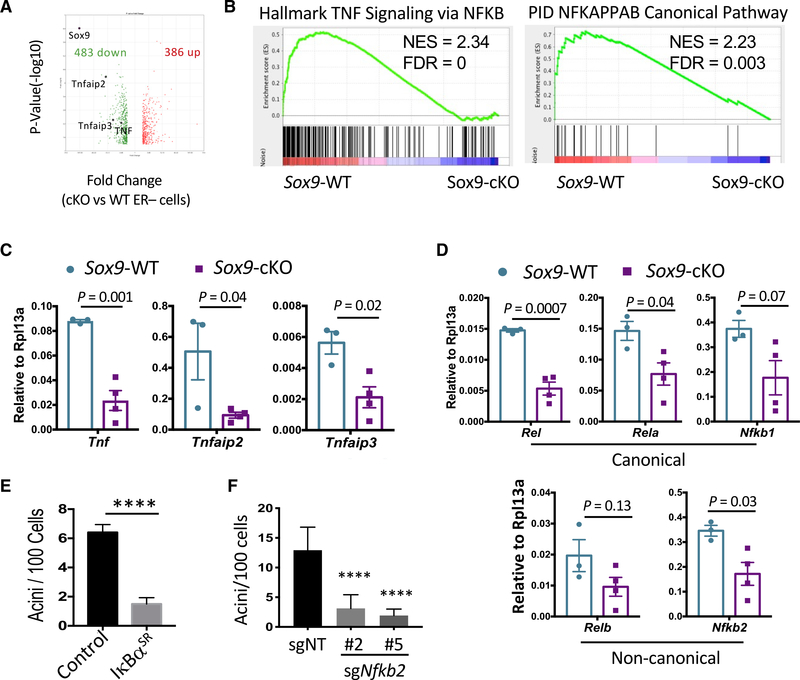
Figure 2. Sox9 Deletion Leads to NF-κB Signaling Defect In Vivo.
(A) Volcano plot comparing the transcriptomes of Sox9-WT (Sox9F/F) and Sox9-cKO (MMTV-iCre; Sox9F/F) ER− luminal cells. Genes with >2-fold expression difference and p < 0.05 were plotted. Total RNA of sorted ER− luminal cells (n = 3 mice per group, 8–12 weeks of age in diestrus) was used for microarray analysis.
(B) GSEA analysis showing enrichment of representative NF-κB-related gene sets in Sox9-WT ER− luminal cells compared to Sox9-cKO cells.
(C) Validation of NF-κB target genes in ER− luminal cells sorted from either Sox9-WT or Sox9-cKO animals by qRT-PCR (n = 3–4 per group, 8–12 weeks of age in diestrus). Mean ± SEM.
(D) Expression levels of NF-κB family transcription factors in Sox9-WT or Sox9-cKO ER− luminal cells, as measured by qRT-PCR (n = 3–4 per group, 8–12 weeks of age in diestrus). Mean ± SEM.
(E) Acinus-forming ability of ER− luminal cells transduced with the IκBαSR or control vector. FACS-sorted cells from C57BL/6J were transduced in organoid culture, puromycin selected, and then reseeded for measuring acinus-forming ability. Representative results of two experiments are shown. Mean ± SEM. ****p < 0.0001.
(F) Acinus-forming ability of Rosa26-Cas9 ER− luminal cells transduced with lentiviral vectors expressing Nfkb2-targeting or control non-targeting guide RNAs. FACS sorted cells were transduced in organoid culture, puromycin selected, and then reseeded for measuring acinus-forming ability. Two Nfkb2-targeting sgRNAs were used to control specificity. Representative results of two experiments are shown. Statistical analysis was performed by one-way ANOVA with Tukey multiple comparison correction. Mean ± SEM. ****p < 0.0001.

