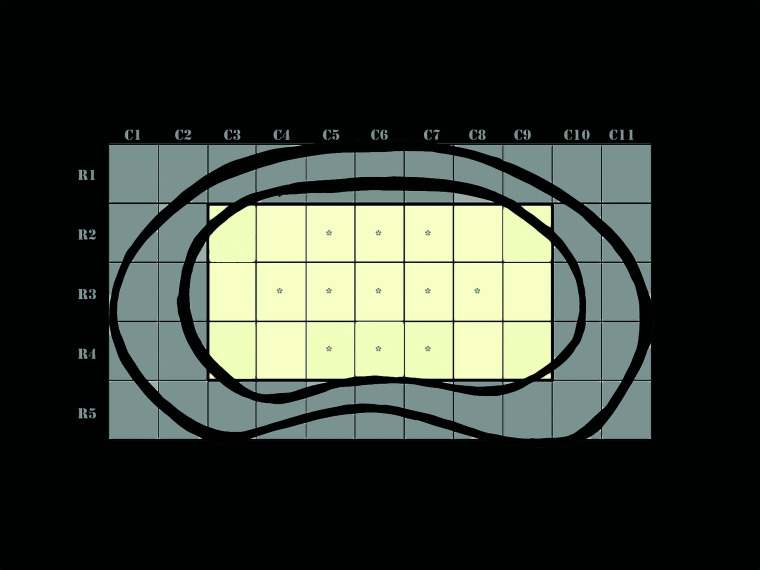
FIG 1.
Artistic rendering of a fixed-sized intervertebral disc to which T2 values of all individual discs were interpolated. For each disc, T2 values of 55 equally sized regions were available that could be represented by a grid with 11 (left-to-right) columns (C1–C11) and 5 anterior-to-posterior rows (R1–5). To exclude the influence of the outer annulus fibrosus, we used the mean T2 time of the central 21 regions (shaded yellow) indicated by rows R2–4 and columns C3–9 to represent the T2 time of any given disc. Of these 21 regions, 11 regions with the highest T2 values were assumed to represent the core of the disc (asterisk), which would be least affected by the inner annulus fibrosus. Mean T2 value of these 11 pixels was assumed to represent the mean T2 time of the nucleus pulposus of the disc.

