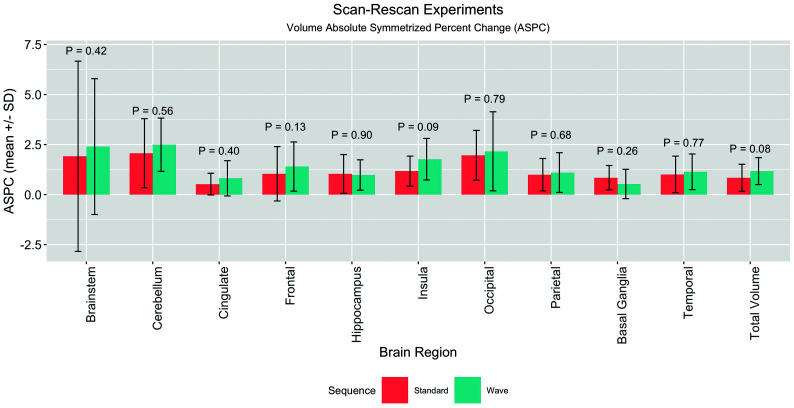
Fig 2.
Barplot summarizing the results of the scan-rescan experiments in 10 healthy volunteers. The graph compares the mean and SD of the ASPC of the same sequence (ie, Wave compared with Wave, and standard compared with standard). Each sequence was acquired in different parts of the same scan session (see Materials and Methods for more details). The comparison of the Wave and Standard ASPC was not statistically different for the brain regions studied using a paired t test.

