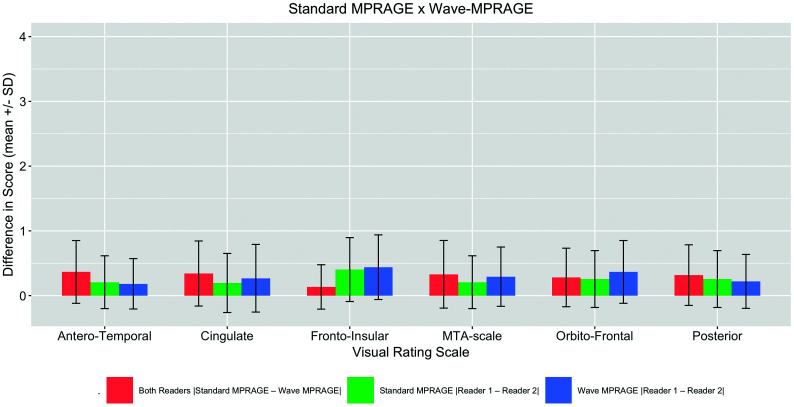
Fig 5.
Barplot demonstrating the absolute values of the differences in the visual rating scores (mean ± SD) for the Wave MPRAGE and standard MPRAGE sequences (red bars). Differences between the 2 raters for the standard MPRAGE images (green bars) and Wave MPRAGE images (blue bars) are also provided. MTA indicates medial temporal lobe.

