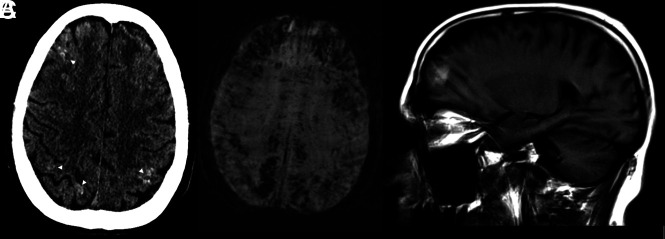
Fig 2.
Patient 2. A, CT scan shows multiple subcortical and subpial petechial hemorrhages. B and C, MR imaging, limited by motion artifacts. B, Susceptibility-weighted axial image shows extensive SWI abnormality C, T1 sagittal, noncontrast image shows some breakthrough macroscopic parenchymal hematomas.

