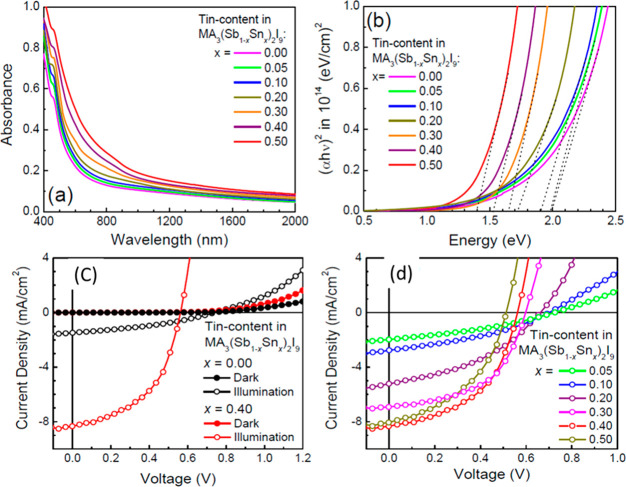
Figure 5.
UV–vis spectra (a) and Tauc plot (b) of the MA3Sb2I9 doped with different Sn content. J–V curves of the PSCs based on MA3(Sb1–xSnx)2I with x = 0 and 0.40 (c) and x = 0.05, 0.10, 0.20, 0.30, 0.40, and 0.50 (d). Reprinted with permission from ref (16). Copyright 2018 American Chemical Society.

