
. 2020 Oct 29;5(44):28597–28605. doi: 10.1021/acsomega.0c03536
© 2020 The Authors. Published by American
Chemical Society
This is an open access article published under an ACS AuthorChoice License, which permits copying and redistribution of the article or any adaptations for non-commercial purposes.
Figure 13.
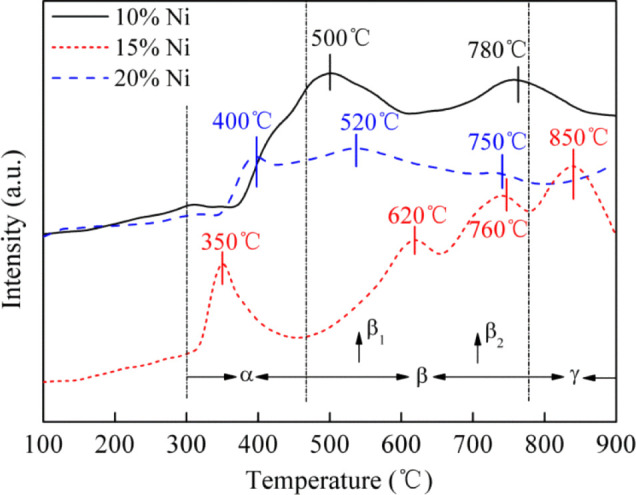
H2-TPR curves of catalysts.