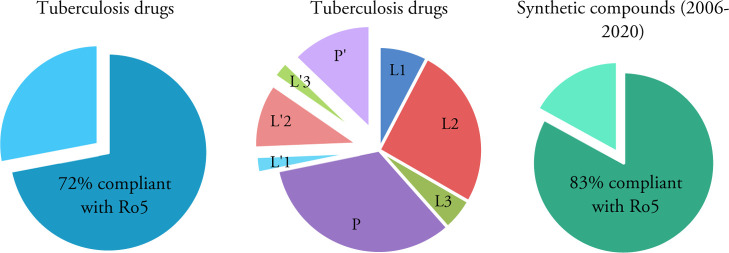
Figure 1.
Pie chart presentation of the percentage of the TB drugs (left and middle) and analyzed anti-TB synthetic compounds (right) compliant with Lipinski’s Ro5. L1, L2, L3, P: first, second, third line, and pipeline TB drugs compliant with Ro5. L′1, L′2, L′3, P′: first, second, third line, and pipeline TB drugs not compliant with Ro5.

