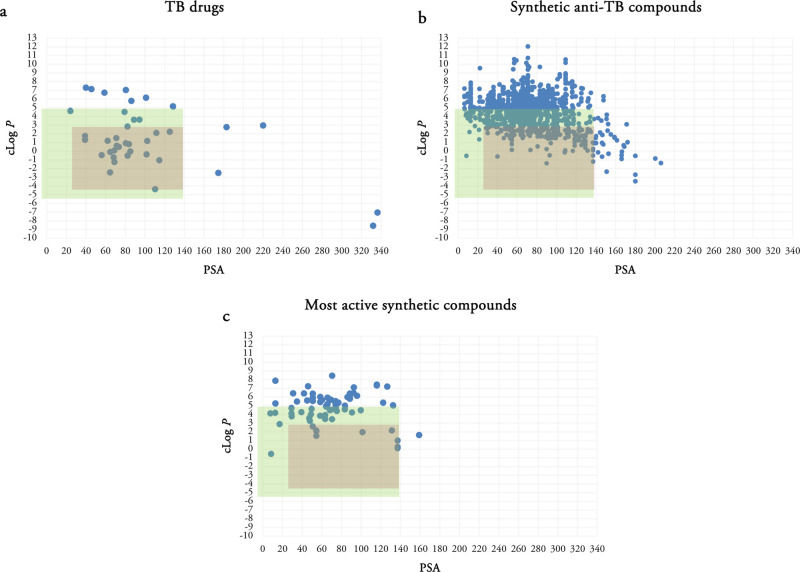
Figure 5.
Scatterplots of the selected publications using clog P and PSA as two variables. Two physiochemical properties (clog P and PSA) of TB drugs (a), synthetic anti-TB compounds (b), and the most active synthetic compounds (c) are evaluated. Green rectangle determines the QED space and pink rectangle represents our putative TB space.

