
Figure 4.
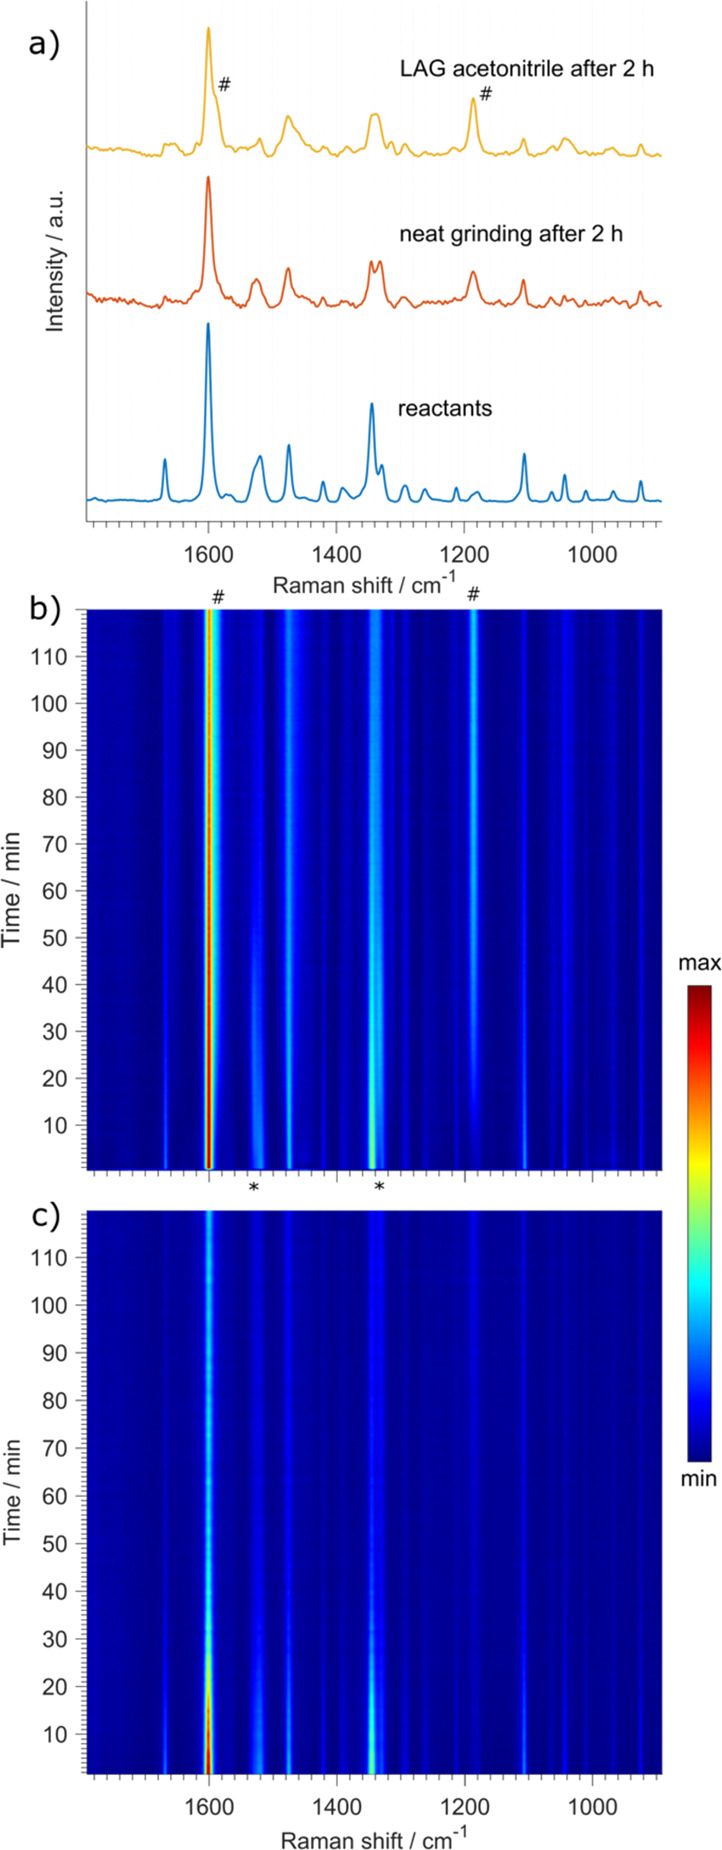
In situ Raman monitoring of dantrolene synthesis from 1-amino hydantoin hydrochloride and 5-(4-nitrophenyl)furfural. (a) Raman spectra of the 1:1 reactant mixture and final product dantrolene for NG and LAG reaction using acetonitrile. (b) Two-dimensional time-resolved plot of in situ-collected and baseline-subtracted Raman spectra for an LAG using acetonitrile (50 μL). An intermediate may be noticed by the bands appearing and disappearing denoted with “*”. The most characteristic bands of the product at 1186 and at 1590 cm–1 as a shoulder to the strongest band at 1600 cm–1 are denoted with “#”. (c) Two-dimensional time-resolved plot of in situ-collected and baseline-subtracted Raman spectra for a neat grinding reaction.