
Figure 5.
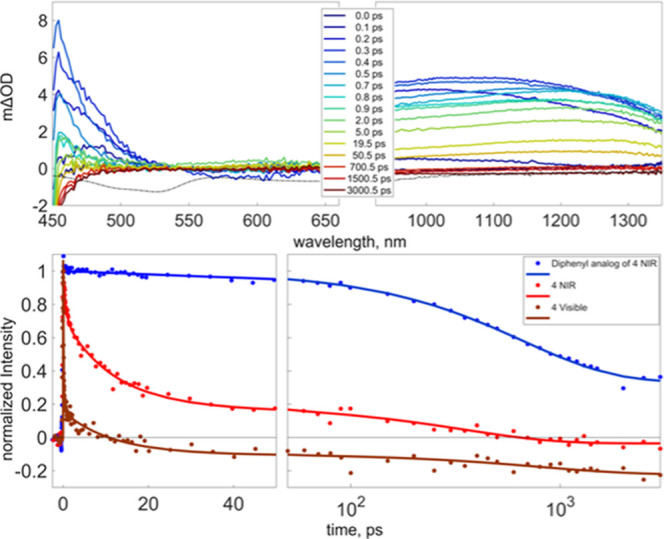
Transient change in optical density following excitation of 4 in DCM at 400 nm. The dashed line in the upper two panels represents the inverted absorption spectrum for reference. In the bottom panel, the circles are the time evolution of the dominant principle component of the singular value decomposition (SVD) analysis and the solid lines are the fit to a sequential set of first-order events (Supporting Information Figures S22–S24).