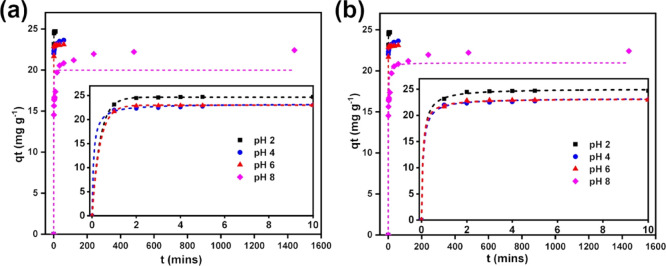
Figure 7.
Fitting of the experimental adsorption kinetics data at four different solution pH of 2, 4, 6, and 8 by nonlinear (a) pseudo-first-order model and (b) pseudo-second-order model. Experimental data is indicated by dot points, and isotherm fits are shown by dashed lines. The insets provide magnification into the initial time region between 0 and 10 min, where a rapid increase in qt was obtained at pH below 8.

