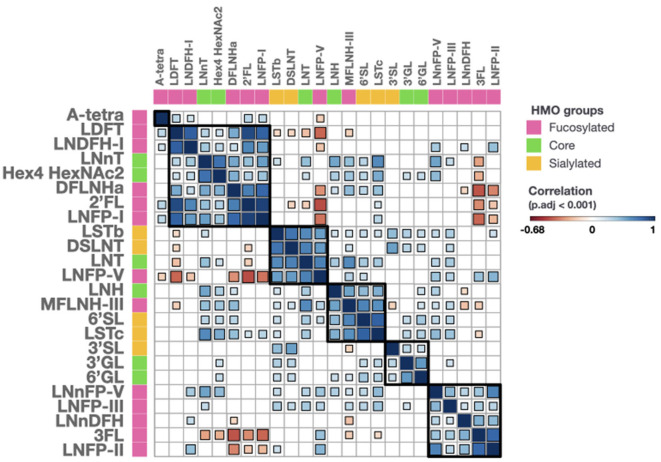
Figure 2.
Correlations of all measured HMOs. HMOs are classified into 3 groups, fucosylated (pink), core (green) and sialylated (orange). Correlation values range from −0.68 (dark red) to 1 (dark blue). Size and color of a square are proportional to the correlation coefficient value. Squares are only shown when the adjusted for multiple testing p-value is below 0.001. 2'FL, 2'-O-Fucosyllactose; 3FL, 3-O-Fucosyllactose; 3'GL, 3'-O-Galactosyllactose; 3'SL, 3'-O-Sialyllactose; 6'GL, 6'-O-Galactosyllactose; 6'SL, 6'-O-Sialyllactose; A-tetra, A-tetrasaccharide; DFLNHa, Difucosyllacto-N-hexaose a; DSLNT, Disialyl-lacto-N-tetraose; Hex, Hexose; HexNAc, N-acetylhexosamine; LDFT, Lactodifucotetraose; LNDFH-I, Lacto-N-difucohexaose-I; LNFP-I,-II,-III,-V, Lacto-N-fucopentaose-I,-II,-III,-V; LNH, Lacto-N-hexaose; LNnDFH, Lacto-N-neodifucosylhexaose; LNnFP, Lacto-N-neofucopentaose; LNnFP-V, Lacto-N-neofucopentaose-V; LNnT, Lacto-N-neotetraose; LNT, Lacto-N-tetraose; LSTc, Sialyllacto-N-tetraose c; MFLNH-III, Monofucosyllacto-N-hexaose-III.

