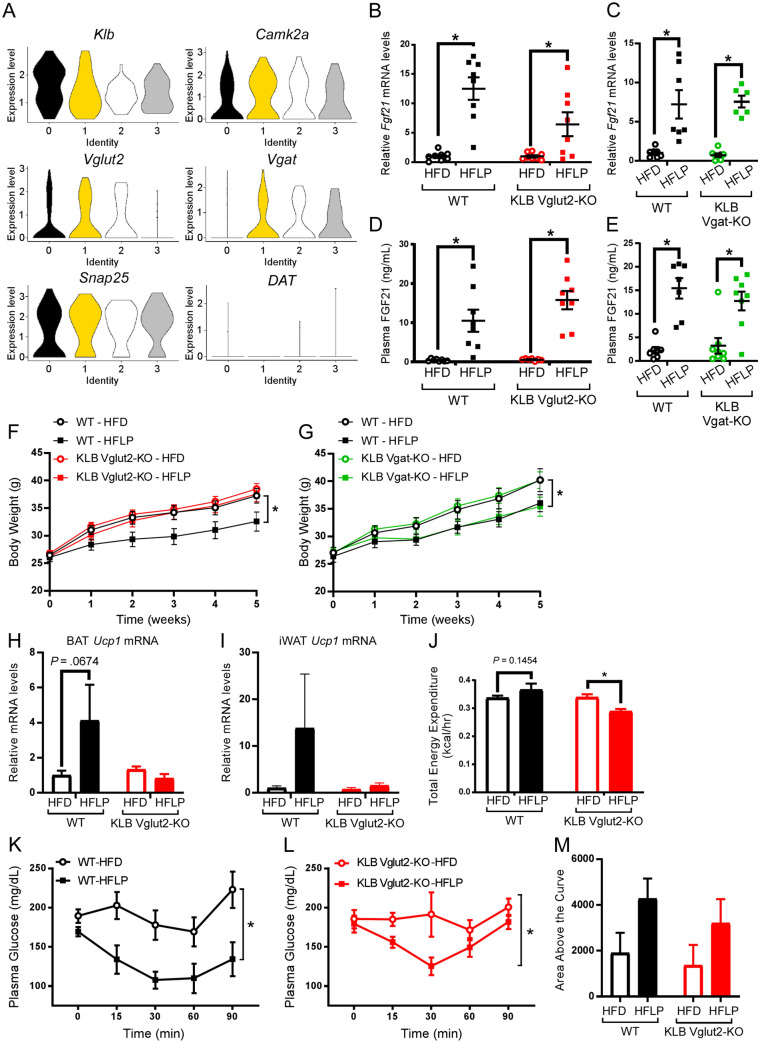
Figure 3.
FGF21 signaling in glutamatergic, but not GABAergic, neurons is required to protect against weight gain during dietary protein restriction in DIO mice. (A) Violin plots of in-silico single cell RNA sequencing analysis of relative mRNA expression of indicated molecular identifiers in Klb expressing neurons isolated from the hypothalamus (n = 183 neurons). (B,C) Relative Fgf21 mRNA expression in the liver of wild-type (WT) mice and mice lacking β-klotho (KLB) in (B) Vglut2-expressing cells (KLB Vglut2-KO mice) or (C) Vgat-expressing cells (KLB Vgat-KO mice) following 5 weeks on high fat diet (HFD) or high fat, low protein diet (HFLP) (n = 6–8 mice/group). (D,E) Circulating FGF21 protein levels in plasma from (D) WT and KLB Vglut2-KO mice or (E) WT and KLB Vgat-KO mice following 5 weeks on HFD or HFLP (n = 7–8 mice/group). (F) Body weight curves of WT and KLB Vglut2-KO mice on HFD or HFLP over 5 weeks (n = 11–15 mice/group). (G) Body weight curves of WT and KLB Vgat-KO mice on HFD or HFLP over 5 weeks (n = 8–10 mice/group). (H,I) Relative Ucp1 mRNA levels in brown adipose tissue (BAT) (H) and inguinal white adipose tissue (iWAT) (I) of wild-type (WT) mice and mice lacking β-klotho (KLB) in Vglut2-expressing cells (KLB Vglut2-KO mice) on high fat diet (HFD) or high fat, low protein diet (HFLP) (n = 7–8 mice/group). (J) Total energy expenditure (EE) in WT and KLB Vglut2-KO mice on HFD or HFLP measured by indirect calorimetry (n = 8 mice/group). (K,L) Plasma glucose levels during an insulin tolerance test (ITT) in (K) WT and (L) KLB Vglut2-KO mice, respectively, on HFD or HFLP (n = 6 mice/group). (M) Quantification of the average area above the curve for the ITTs plotted in (K) and (L). Values are mean ± SEM. 2-way ANOVA with Holm-Sidak’s multiple comparisons test performed for all panels with mice on HFD used as the control condition within genotypes for statistical comparisons, * = P < 0.05.

