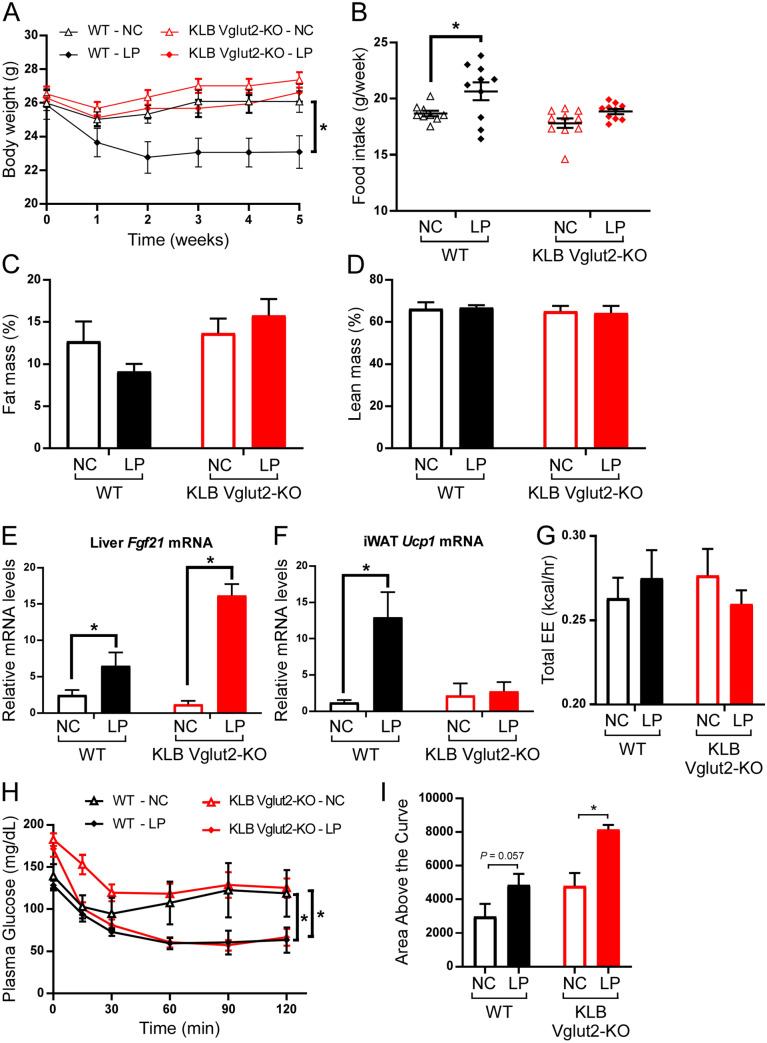
Figure 4.
Loss of KLB in glutamatergic neurons in lean mice blocks the effects on body weight, but not insulin sensitivity associated with dietary protein restriction. (A) Body weight curves of wild-type (WT) mice and mice lacking β-klotho (KLB) in Vglut2-expressing cells (KLB Vglut2-KO mice) on normal chow (NC) or low protein chow (LP) over 5 weeks (n = 9–10 mice/group). (B) Average weekly food intake of WT and KLB Vglut2-KO mice on NC or LP. (C,D) Percentage of fat mass (C) and lean mass (D) in WT and KLB Vglut2-KO mice after 5 weeks on NC or LP (n = 5 mice for each group). (E) Relative Fgf21 mRNA levels in the liver of WT and KLB Vglut2-KO mice following 5 weeks on NC or LP (n = 8–9 mice/group). (F) Relative Ucp1 mRNA expression in inguinal white adipose tissue (iWAT) of WT and KLB Vglut2-KO mice on NC or LP (n = 9 mice/group). (G) Total energy expenditure (EE) in WT and KLB Vglut2-KO mice on NC or LP determined by indirect calorimetry (n = 8 mice/group). (H) Plasma glucose levels during an insulin tolerance test (ITT) in WT and KLB Vglut2-KO mice on NC or LP (n = 6 mice/group). (I) Quantification of the average area above the curve for the ITT curves plotted in (H). Values are mean ± SEM. 2-way ANOVA with Holm-Sidak’s multiple comparisons test performed for all panels with mice on NC used as the control condition within genotypes for statistical comparisons, * = P < 0.05.

