
Figure 3.
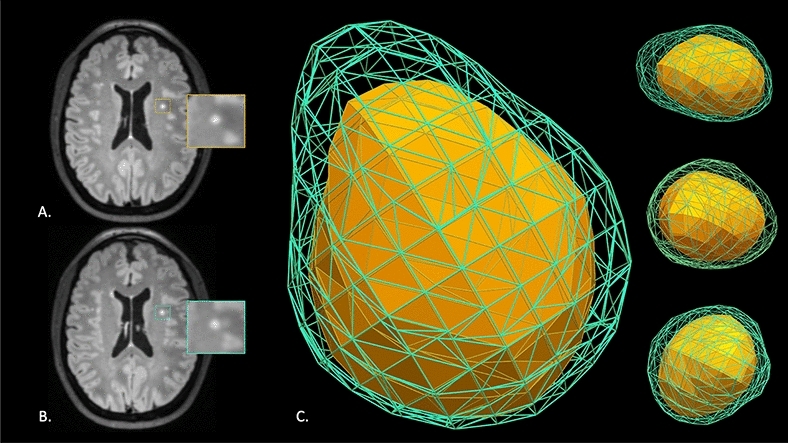
Two-dimensional (2D) MRI axial FLAIR brain images highlighting a single SVD lesion from a 42-year-old white woman from (A) time point 1 and (B) time point 2 (1-year follow-up). Visual simulation model in 3D demonstrating displacement and deformation of the lesion at time point 2 (fluorescent green) compared to the original position at time point 1 (solid yellow). (C) Note the symmetric and more uniform growth between time points in the simulation model that is not apparent when comparing high-resolution MRI data at 3-Tesla (A,B).