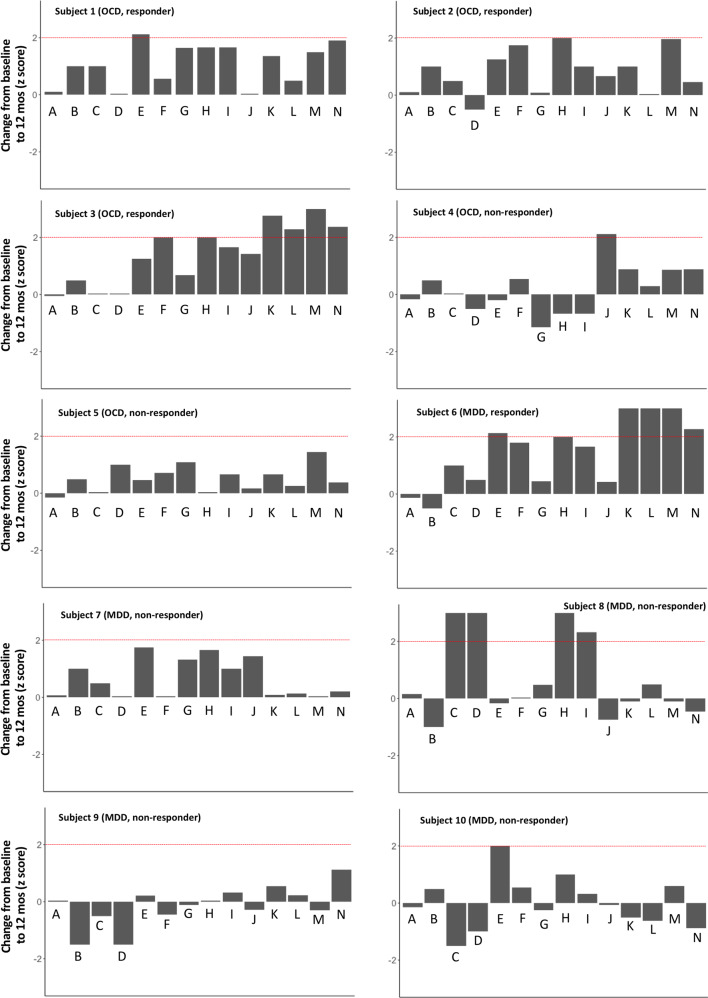
Fig. 1. Individual barplots representing change on neuropsychological tests following MRgFUS-AC.
The y-axis represents change from baseline to 12 months for each patient as a standardized score (z score). Deviations below 0 represent decline and deviations above 0 represent improvement. The dotted red lines indicate a clinically significant improvement (i.e., 2 SD improvement). Since no patients’ performance declined ≥2 SD, no corresponding line representing a decline was added). Subject 1 did not complete the Iowa Gambling Task (IGT) at 12-months and therefore the subject’s 6-month scorewas used to compute a change score. A = CVLT total recall; B = CVLT delayed free recall; C = CVLT delayed cued recall; D = CVLT delayed recognition discrimination; E = BVMT-R immediate recall; F = BVMT-R delayed recall; G = Symbol Digit Modalities Test; H = D-KEFS Sorting Test sorting score; I = D-KEFS Sorting Test description score; J = IGT; K = FrSBe total score; L = FrSBe disinhibition score; M = FrSBe apathy score; N = FrSBe dysexecutive score.

