
Figure 4.
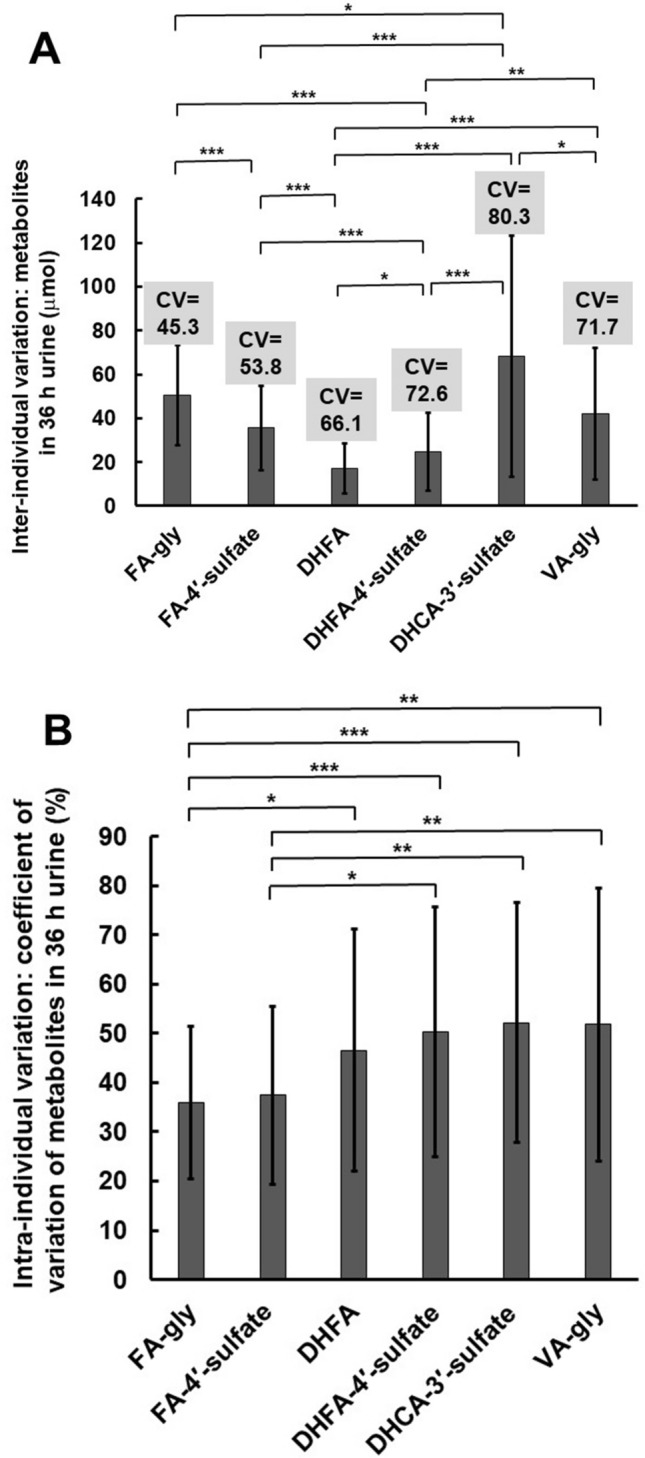
Inter-individual and temporal intra-individual variation in excretion of metabolites from coffee. (A) Excretion of six major urinary metabolites over 36 h after coffee consumption (n = 38) showing inter-individual variation. Values in grey boxes above columns indicate coefficient of variation (CV, %). (B) Excretion of six major urinary metabolites over 36 h after coffee consumption (n = 38) showing the CV of intra-individual metabolite concentrations, with error bars indicating standard deviation of CV values.* < 0.05; ** < 0.01; *** < 0.001, from student paired t-test.