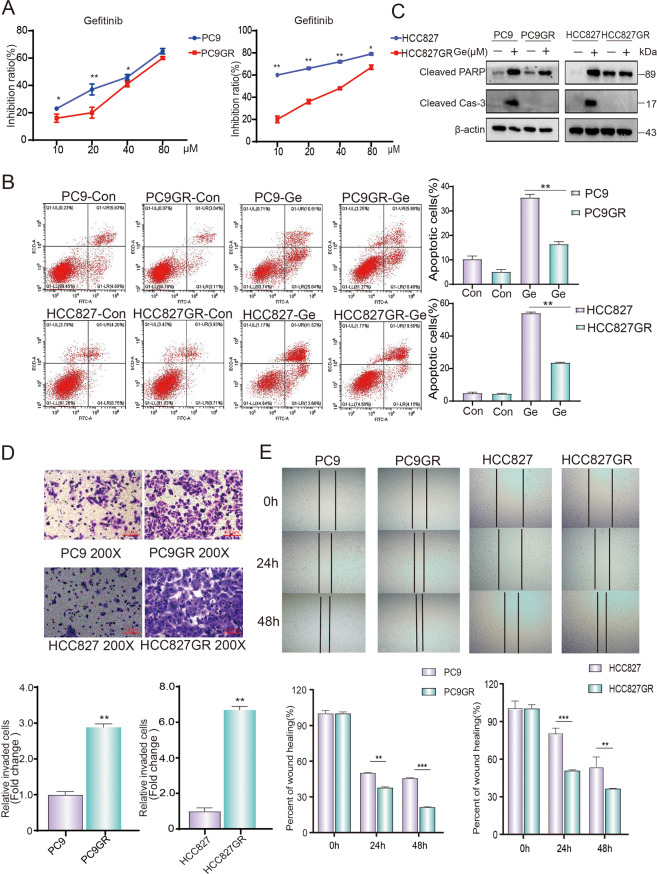
Fig. 1. Construction and characterization of gefitinib-resistant cell lines.
A NSCLC cells were treated with different concentrations of gefitinib for 24 h. The inhibition rate of drugs in NSCLC cells was determined by CCK-8. B NSCLC cells were treated with gefitinib for 24 h, stained with Annexin V-FITC and PI, and detected by flow cytometry. C Western blotting was performed to study the expression of cleaved caspase-3 and cleaved PARP in NSCLC cells treated with indicated drugs. D Representative results of transwell analysis. The pictures were taken 24 h after the boarding (picture display magnification: ×200). E Representative results of wound healing assay. Pictures were taken every 24 h at the indicated time (picture display magnification: ×40). Cleaved Cas-3, Cleaved caspase-3; Con, control; Ge, gefitinib. The data were presented as mean ± SD. Asterisk indicates statistically significant difference (***p < 0.001, **p < 0.01, *p < 0.05).

