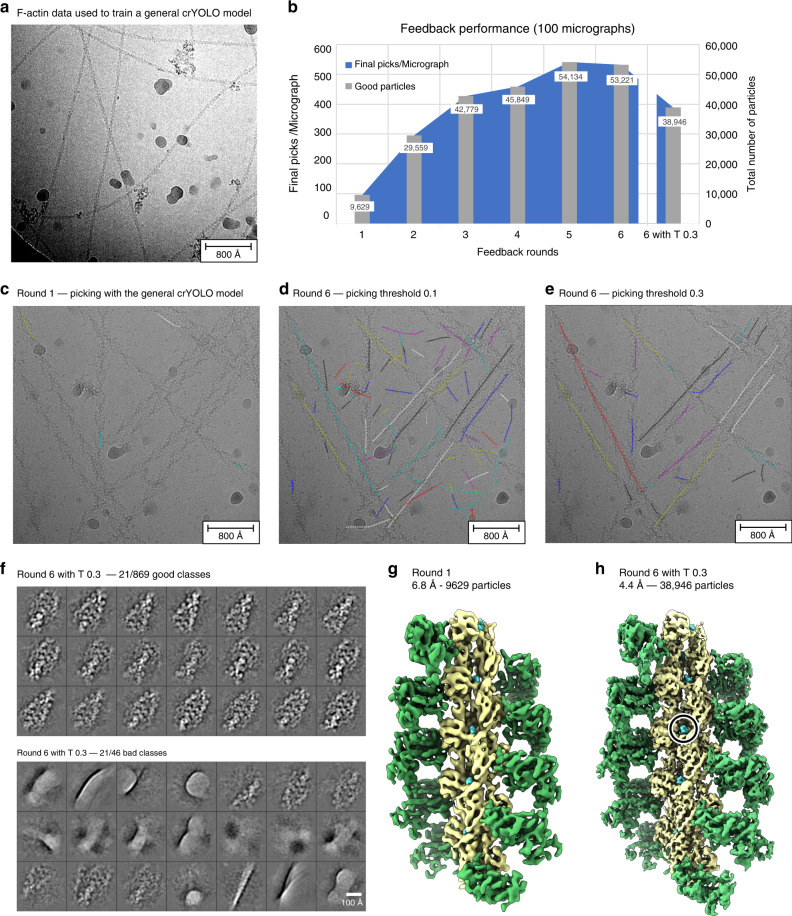
Fig. 5. Ligand identification within an actomyosin complex.
a Representative micrograph of the F-actin data used to train crYOLO. b Progression of the number of “good” particles per micrograph (blue) and in total (gray) when applying the intermediate picking models of the feedback loop to a fixed subset of 100 micrographs. The dipping curve at the end indicates the desired loss of low-quality picks that are excluded when a higher picking threshold (0.3) is used. c Representative micrograph of the actomyosin complex highlighting the weak initial picking results when using the crYOLO model trained on F-actin data (see a). d Particle picking performance on the same micrograph using the final picking model. While filaments are now traced much more effectively, the model also picks unwanted filament crossings and contamination. e Increasing the picking threshold from 0.1 to the default value of 0.3 minimizes the amount of false positive picks, while maintaining the desired filament traces. f Representative 2D class averages labeled “good” (top) and “bad” (bottom) by Cinderella based on 100 micrographs and using the final model for picking. g 3D reconstruction of the actomyosin complex computed from 100 micrographs using the initial picking model. h 3D reconstruction computed from the same 100 micrographs using the final optimized picking model. The resolution is sufficient to verify the binding of a ligand (circled).

