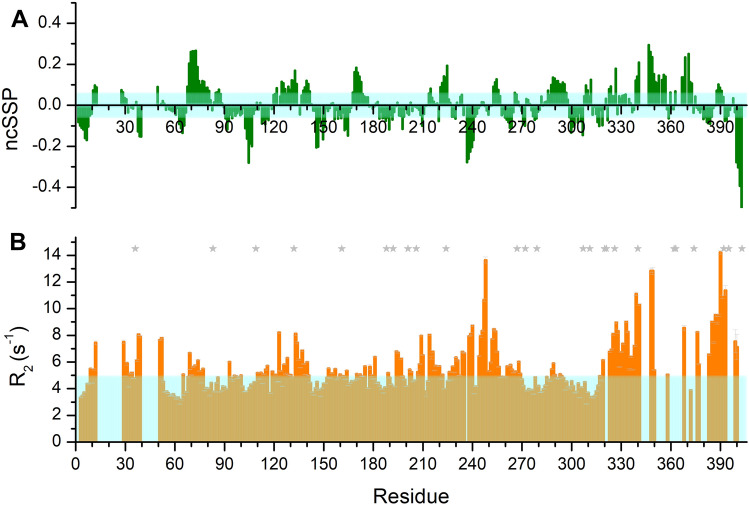
Figure 3.
(A) Neighbor-corrected secondary structure propensity (ncSSP) values obtained through the online ncSSP tool (https://st-protein02.chem.au.dk/ncSPC/)32 using the chemical shift values reported in Supplementary Table S2. Positive and negative values correspond to α-helical and β-strand propensities, respectively. The light cyan box represents the ± 0.05 value. Few regions display a moderate α-helix propensity (SSP > 0.2) while most of the protein is largely disordered. (B) 15N R2 values reported as a function of residue number. The light cyan box indicates the modal value.

