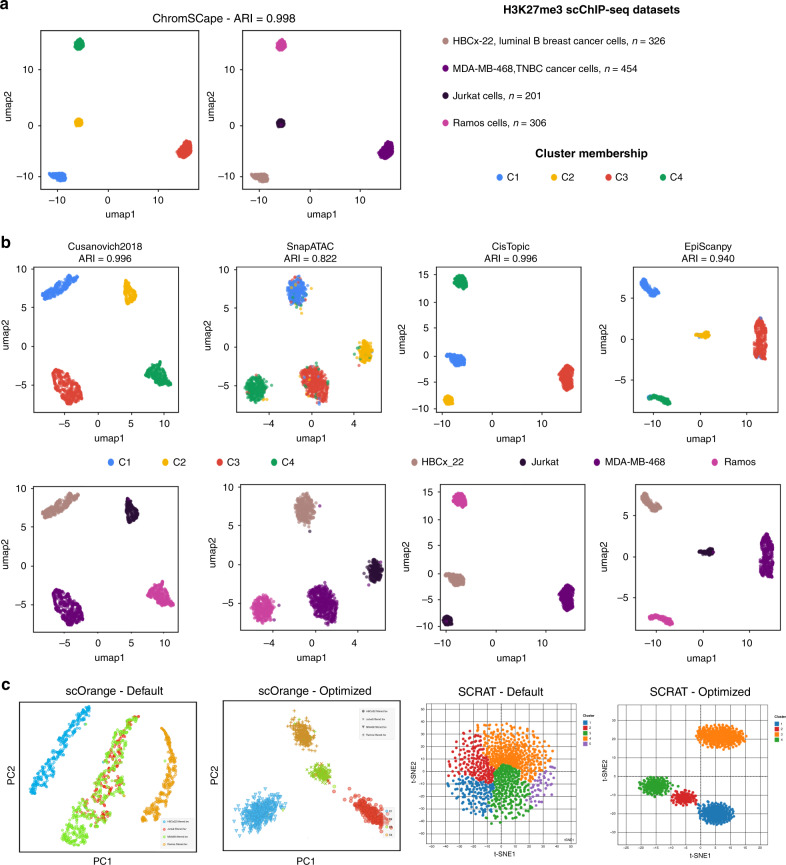
Fig. 2. Benchmarking single-cell epigenomic tools with an in-silico mix of H3K27me3 scChIP-seq.
The mix is composed of human cells from an untreated PDX (HBCx-22), human T cells (Jurkat), and B cells (Ramos) taken from1 and from a TNBC cell line (MDA-MB-468). (a) UMAP plots obtained with ChromSCape colored according to cluster and sample of origin. Adjusted Random Indexes (ARI) are indicated above the plot. (b) UMAP plots colored according to cluster and sample of origin with other single-cell epigenomic analysis methods: Cusanovich2018, SnapATAC, CisTopic, and EpiScanpy. Adjusted Random Indexes (ARI) are indicated above the plots. (c) Snapshots from scOrange and SCRAT applications. PCA and t-SNE representations from scOrange and SCRAT respectively, using default parameters or after manually optimizing parameters.

