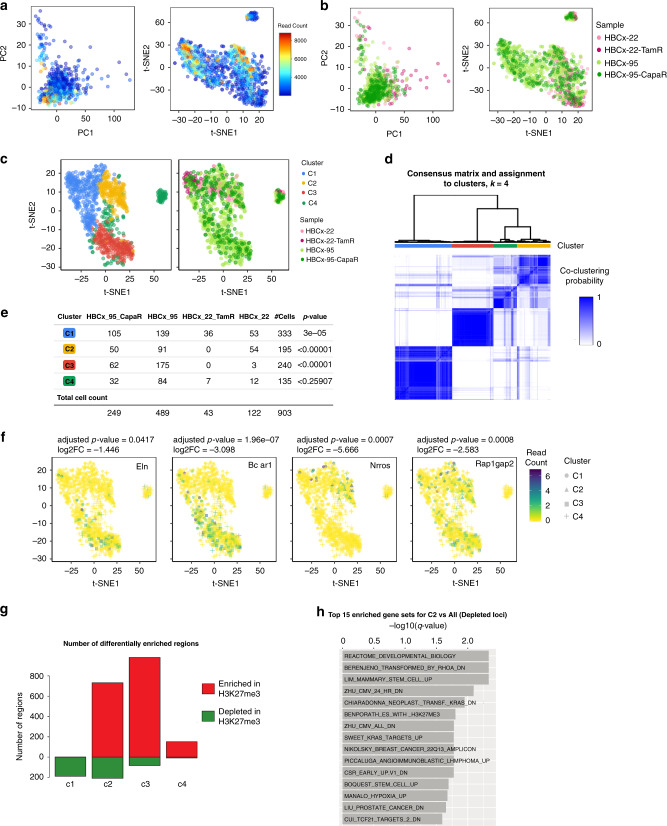
Fig. 4. ChromSCape deconvolves epigenomic landscapes within the tumor micro-environment.
Cells belonging to samples HBCx-22, HBCx-22-TamR, HBCx-95, HBCx-95-CapaR PDX1. PCA and t-SNE plots are colored according to the amount of uniquely mapped reads per cell (a) and to sample of origin (b). (c) t-SNE representations after correlation filtering (n = 903 cells), colored by cluster or sample of origin. (d) Hierarchical clustering and corresponding heatmap of cell-to-cell consensus clustering scores cells portioning the dataset into k = 4 clusters. Consensus score ranges from 0 (white: never clustered together) to 1 (dark blue: always clustered together). Cluster membership is color-coded above the heatmap. (e) Table of cluster memberships. P-value column results from Pearson’s Chi-squared goodness of fit test without correction, checking if the observed distribution of samples in each cluster differs from a random distribution. Source data are provided as a Source Data file. (f) t-SNE representation of scChIP-seq datasets, points are colored according to H3K27me3 enrichment signals in each cell for genes located within depleted regions in C1 to C4, respectively Eln, Bcar1, Nrros, and Rap1gap2. The adjusted p-values and log2FC of the associated regions are indicated above each plot. (g) Barplot of differentially enriched regions identified by Wilcoxon signed-rank test. Genomic regions were considered enriched (red) or depleted (green) in H3K27me3 if the adjusted p-values were lower than 0.01 and the absolute fold change greater than 1. (h) Barplot displaying the -log10 of adjusted p-values from pathway analysis for cells of cluster C2 compared to all other cells in depleted loci. Only the top 15 significant gene sets, ranked by adjusted p-values, are indicated.

