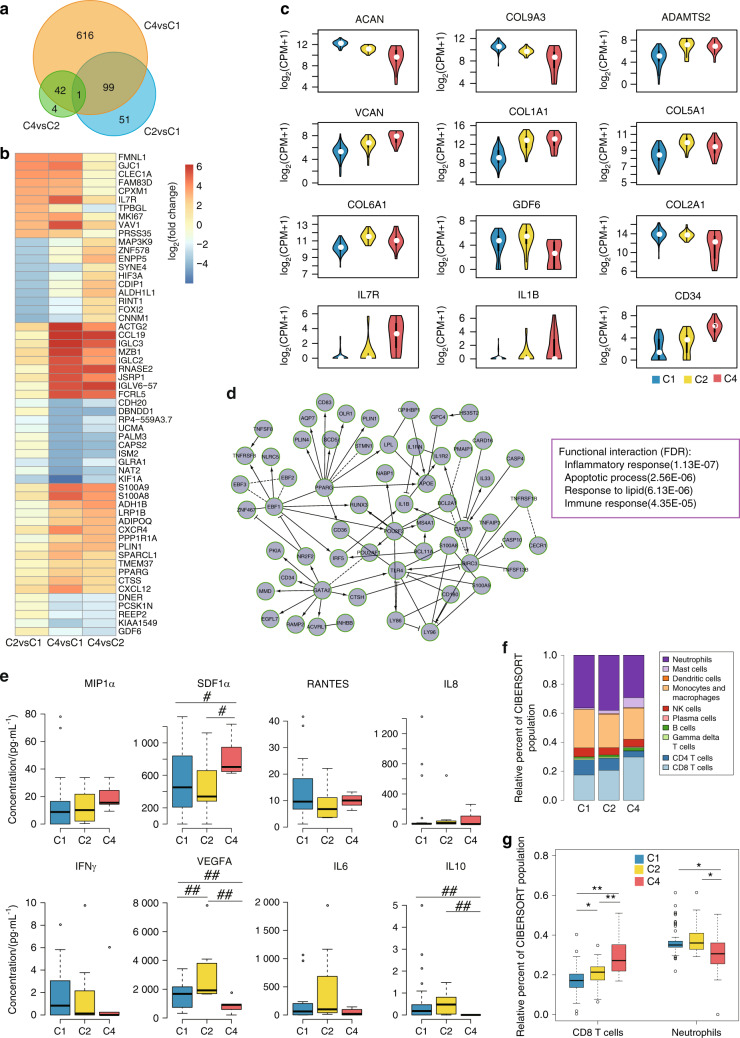
Fig. 2.
Characterization of metabolically disordered OA subtypes. a Venn diagram of differentially expressed protein-coding genes (DEGs). b Heatmap of the top 10 differentially upregulated and downregulated protein-coding genes. c Violin plots showing the expression of cartilage development- and OA-related genes. d The largest functional interaction (FI) network module of differentially expressed genes between C4 and C2. e Box plot of protein expression in hydrarthrosis. f CIBERSORT-inferred relative fractions of different immune cell types across the three metabolically disordered OA subtypes. g Box plot of the relative fractions of CD8+ T cells and neutrophils in OA subtypes. (Wilcoxon rank-sum test; #represents FDR ≤ 0.1, ##represents FDR ≤ 0.05, *represents FDR ≤ 0.01, and **represents FDR ≤ 0.001)

