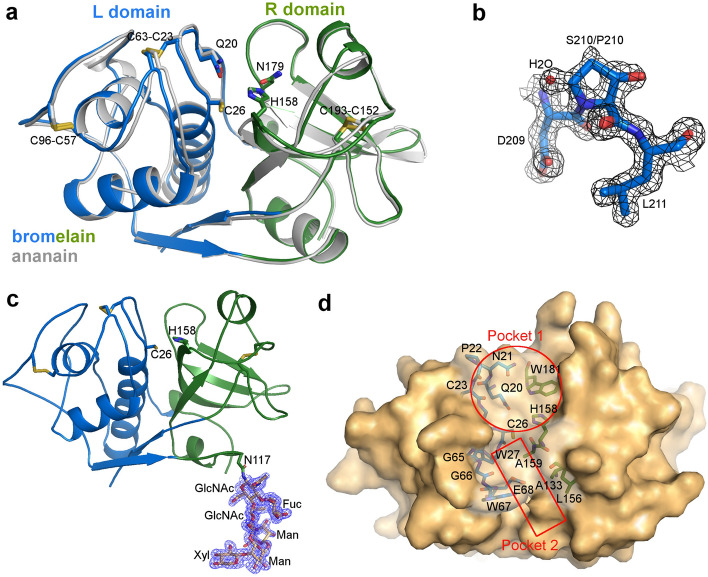
Figure 2.
Overall structure of bromelain and ananain. (a) Cartoon representation of superimposed bromelain (L domain blue and R domain green) and ananain (gray) structures; important catalytic residues and disulfide bonds are represented as sticks. (b) Sticks representation of two different residues (serine and proline) in alternate conformations observed at position 210 of molecule B. 2Fo-Fc electron density map is displayed at a 1σ level. The water molecule shown is only concomitant with the S210 alternate conformation. (c) Sticks representation of the glycosylation of Asn117, 2Fo-Fc electron density map is also displayed at a 1σ level. (d) Surface representation of bromelain, residues forming pocket 1 and pocket 2 are shown as sticks in transparency.

