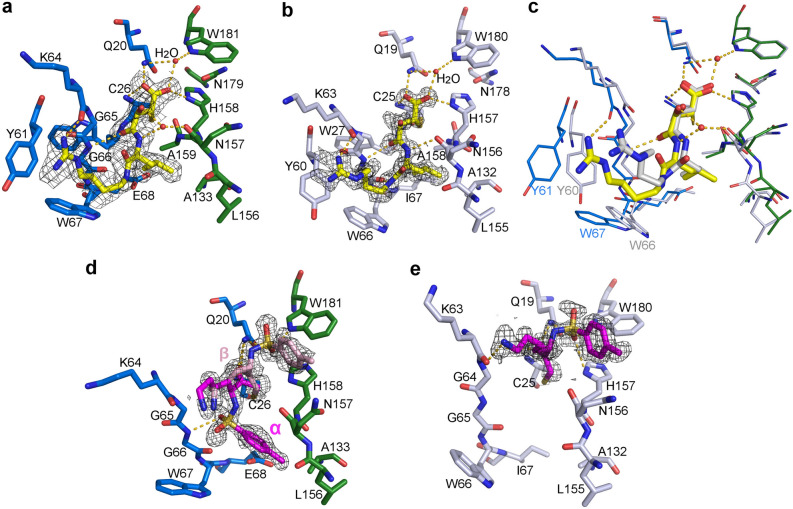
Figure 3.
Structures of bromelain and ananain in complex with E64 and TLCK. (a) Residues from the active site surrounding of the bromelain:E64 complex, bromelain L domain in blue and R domain in green, and E64 in yellow; H-bonds are shown as dashed lines. The feature enhanced electron density map is displayed at a 1σ level around E64. (b) Same as (a) for the ananain:E64 complex (ananain in gray sticks). (c) Superimposition of the bromelain:E64 (blue, green and yellow) and ananain:E64 (gray) complexes. (d) Same as (a) for the monomer B of the bromelain:TLCK complex. The α and β alternate conformations of TLCK are respectively represented as magenta and light pink sticks. (e) Same as (d) for the ananain:TLCK complex (ananain in gray sticks).

