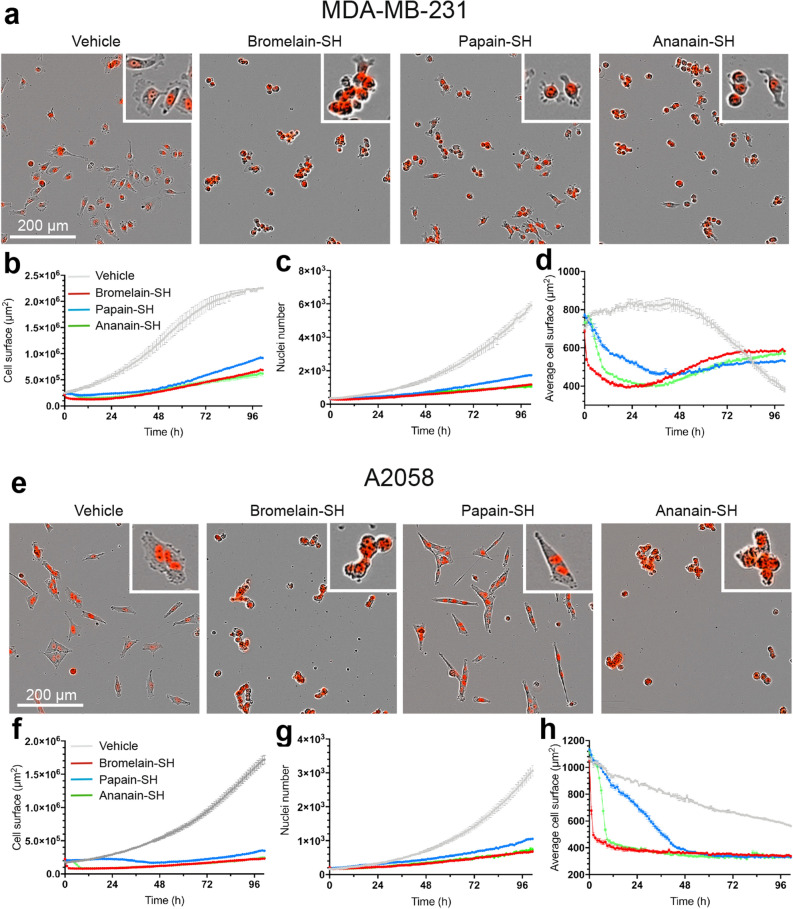
Figure 6.
MDA-MB-231 (a–d) and A2058 (e–h) cells were treated during 100 h with the active (–SH) form of bromelain, papain and ananain (1 µM) or vehicle only. Live cell imaging was used to obtain pictures of the different culture conditions (a and e) and calculate the cell surface (b and f), the number of mKate2+ nuclei (c and g) and the average cell surface (d and h). Pictures were taken after 24 h of treatment. Phase contrast and mKate2 fluorescence images are merged. Scale bar = 200 µm. Data are presented as mean ± SEM (n = 3–4). Kolmogorov–Smirnov test: see Supplementary Table 2.

