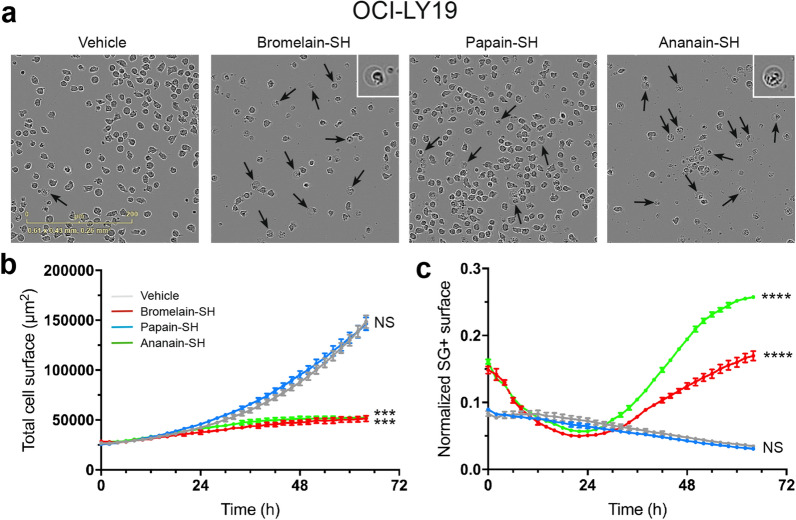
Figure 7.
OCI-LY19 cells were treated during 64 h with the active (–SH) form of bromelain, papain and ananain (1 µM) or vehicle only. Live cell imaging was used to obtain pictures of the different culture conditions (a) and calculate the total cell surface (b) and the normalized SYTOX Green (SG) positive cell surface (c). Pictures were taken after 64 h of treatment. Arrows indicate dead cells. Scale bar = 200 µm. Data are presented as mean ± SEM (n = 3–4). Kolmogorov–Smirnov test: NS, not significant; ***p < 0.001; ****p < 0.0001.

