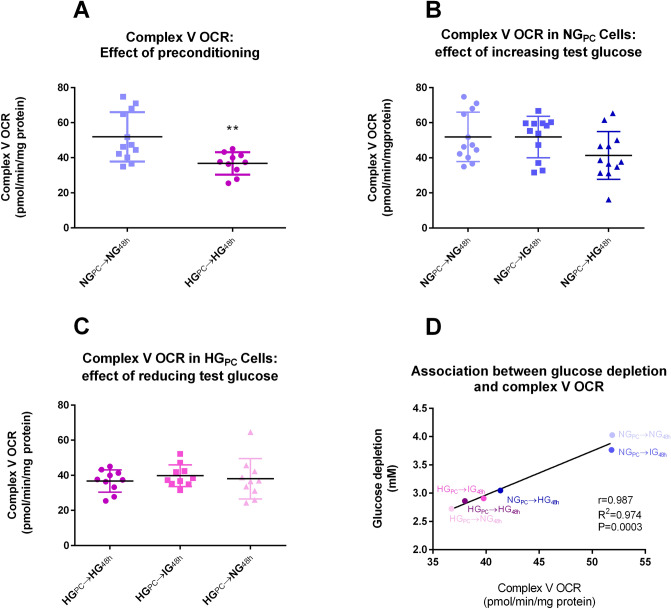
Figure 2.
(A) Effect of glucose preconditioning on complex V-associated OCR (**P < 0.01; Mann Whitney U test). (B) Effect of 48 h exposure of increasing glucose concentrations to NGPC cells (P > 0.05; Kruskal–Wallis). (C) Effect of 48 h exposure of decreasing glucose concentrations in HGPC cells (P > 0.05; Kruskal–Wallis). (D) Correlation of mean complex V-associated OCR with mean glucose depletion from medium under each HG and NG condition. Raw data for glucose depletion are found in Supplementary Fig. S3. Raw data were analysed using Seahorse Wave Software (version 2.3.0.19) prior to graphical presentation using Graphpad Prism version 6.00.

