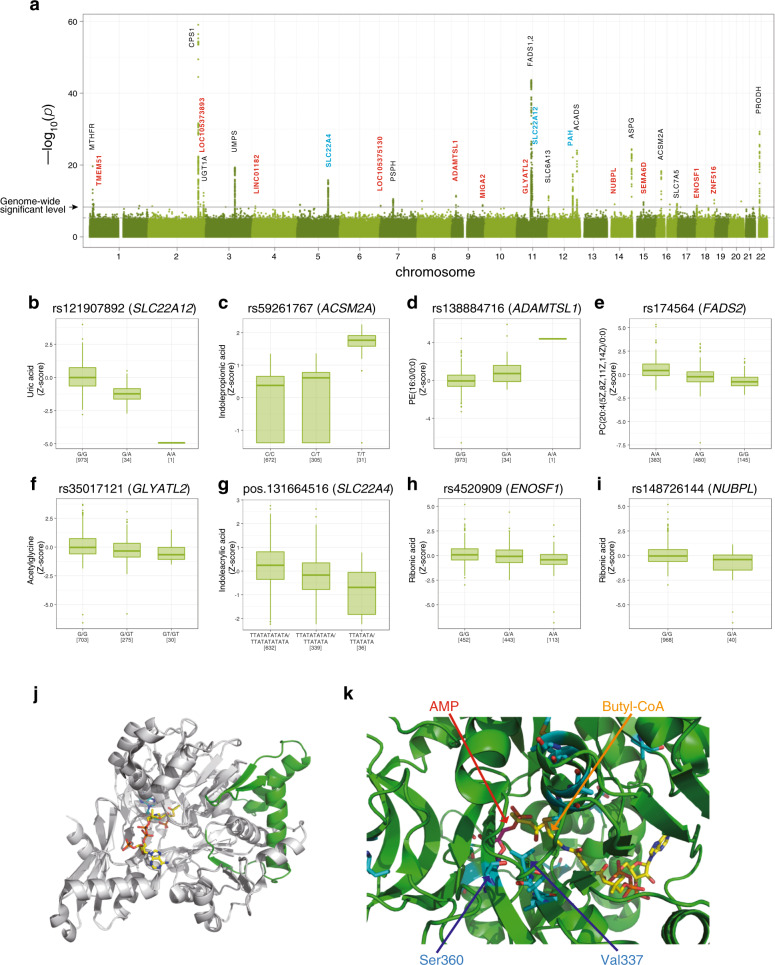
Fig. 1. Associations of metabolites with loci in the current metabolome genome-wide association study.
a Manhattan plots for metabolic traits. The strength of association with plasma metabolite concentrations for the 26 loci is shown based on the results from the association studies for all 1008 samples. The line indicates a suggestive genome-wide significance level with P-value of 4.598 × 10⁻⁹. For gene annotations, novel associations are depicted in cyan, while novel loci are depicted in red. b–i Distribution of the plasma metabolites. Distributions of the plasma metabolites across the genotypes are shown using a box plot. Boxes represent the interquartile range (IQR) between the first quartile (Q1) and third quartile (Q3), and the line inside represents the median. Whiskers denote the lowest and highest values within 1.5× IQR from Q1 and Q3, respectively. Dots represent outliers beyond the whiskers. These figures were made using the R package. j Ribbon representation of the crystal structure of human ACSM2A (PDB ID: 3EQ6). The missed (nontranslated) region and the remaining region caused by the stop-gain variant are depicted in gray and green, respectively. k Structure of the ligand-binding region of human ACSM2A. Two ligands (AMP and butyl-CoA) are represented by a stick model. The residues that differ between human ACSM2A and ACSM2B are also represented by a stick model, depicted in cyan. The two residues Ser360 and Val337, which are speculated to influence the ligand specificity of the enzymes, are indicated by blue arrows.

