Figure 5.
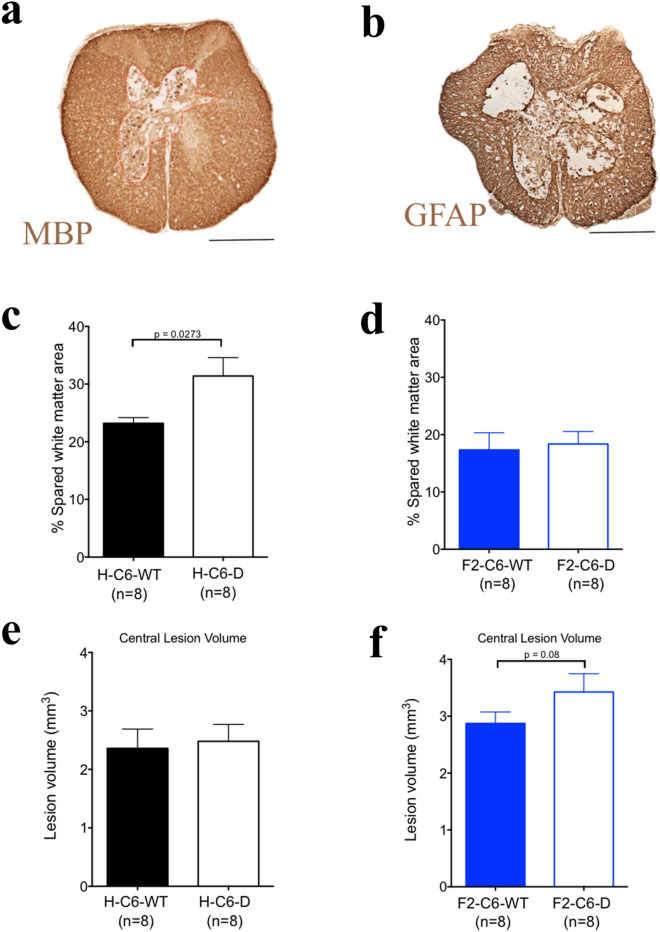
Unbiased stereological quantification of F2-C6-D PVG rats at 42 days. (a) Representative image of myelin basic protein staining near epicenter of injury in an F2-C6-D rat. (b) Representative image of GFAP staining near epicenter of injury in an F2-C6-D rat. (c) Stereological assessment demonstrated a significant increase in % spared tissue in H-C6-D rats (Student’s t test, *p < 0.05). (d) However, in F2-C6-D rats showed no difference in % spared tissue (Student’s t test, p = 0.4). (e) No significant differences were measured in central lesion volume in H-C6-D rats (Student’s t test, p > 0.05). (f) A strong trend for increased central lesion volume in F2-C6-D rats (Student’s t test, *p = 0.08). Data points represent group means ± SEM. Scale bar 500 μm.

