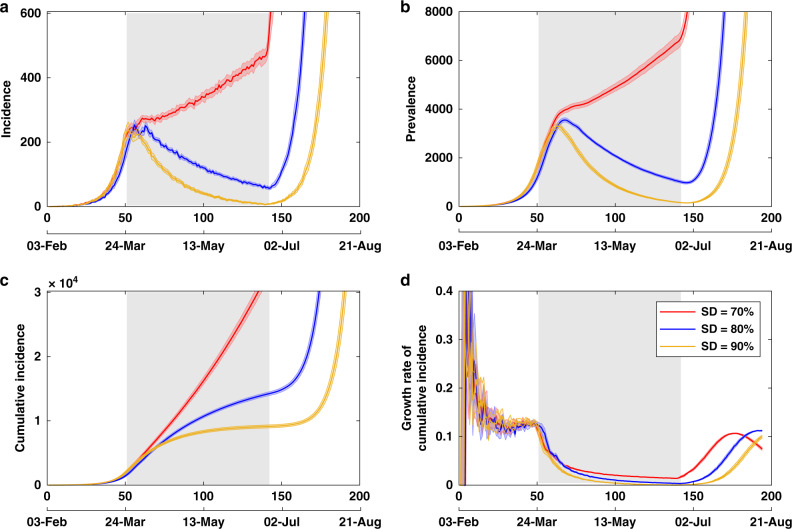
Fig. 2. Effects of social distancing.
Strong compliance with social distancing (at 80% and above) effectively controls the disease during the suppression period, while lower levels of compliance (at 70% or less) do not succeed for any duration of the suppression. A comparison of social distancing strategies, coupled with case isolation, home quarantine and international travel restrictions, across different compliance levels (70, 80 and 90%). Duration of each social distancing (SD) strategy is set to 91 days (13 weeks), shown as a grey shaded area between days 51 and 142 (the start and end days of SD varied across stochastic runs: for 70% SD the last day of suppression was 141.4 on average; for 80% SD it was 144.2; and for 90% SD it was 141.5, see Source data file). Case isolation, home quarantine and restrictions on international arrivals are set to last until the end of each scenario. Traces include a incidence, b prevalence, c cumulative incidence and d the daily growth rate of cumulative incidence , shown as average (solid) and 95% confidence interval (shaded) profiles, over 20 runs. The 95% confidence intervals are constructed from the bias-corrected bootstrap distributions. The alignment between simulated days and actual dates may slightly differ across separate runs.

