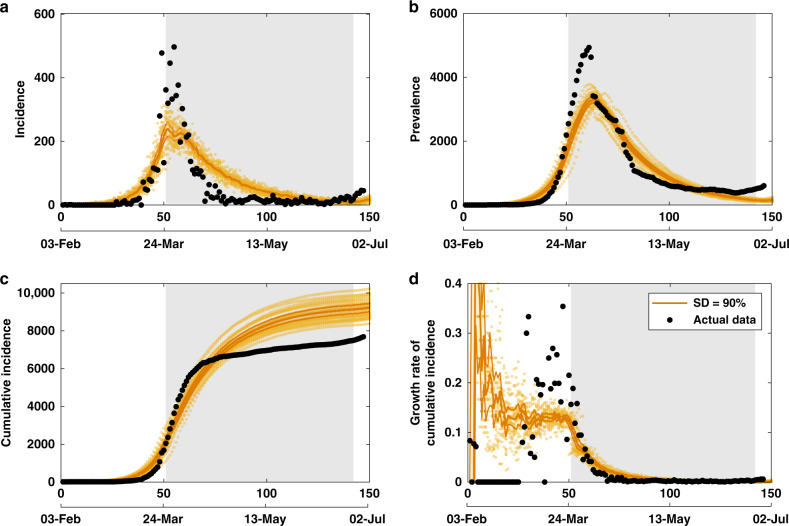
Fig. 3. Model validation with actual data.
A comparison between actual epidemic curves in Australia (black dots, shown until 28 June 2020), and the primary simulation scenario, using a threshold of 2000 cases (crossed on 24 March 2020) and following 90% of social distancing (SD), coupled with case isolation, home quarantine and international travel restrictions, shown until early July 2020 (yellow colour). Duration of the SD strategy is set to 91 days (13 weeks), shown as a grey shaded area. Case isolation, home quarantine and restrictions on international arrivals are set to last until the end of the scenario. Traces include a incidence, b prevalence, c cumulative incidence and d daily growth rate of cumulative incidence, shown as average (solid), 95% confidence interval (thin solid) profiles, as well as the ensemble of 20 runs (scatter). The 95% confidence intervals are constructed from the bias-corrected bootstrap distributions. The alignment between simulated days and actual dates may slightly differ across separate runs. Data sources: refs. 64,67.

