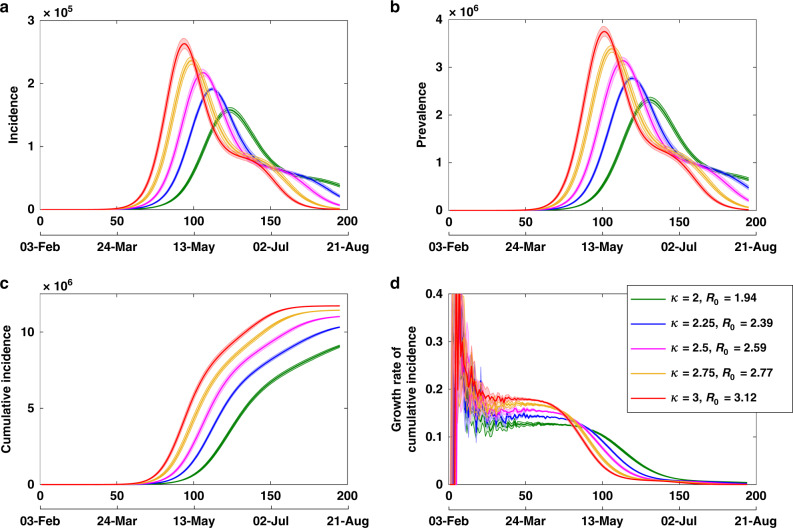
Fig. 5. Model calibration with scaling factor κ.
Tracing d the expected growth rate of cumulative incidence per day, while varying scaling factor κ (proportional to the reproductive number R0), with a incidence, b prevalence and c cumulative incidence. Averages over 20 runs are shown as solid profiles, with 95% confidence intervals shown as shaded profiles. The 95% confidence intervals are constructed from the bias-corrected bootstrap distributions. The alignment between simulated days and actual dates may slightly differ across separate runs.

