
Figure 1.
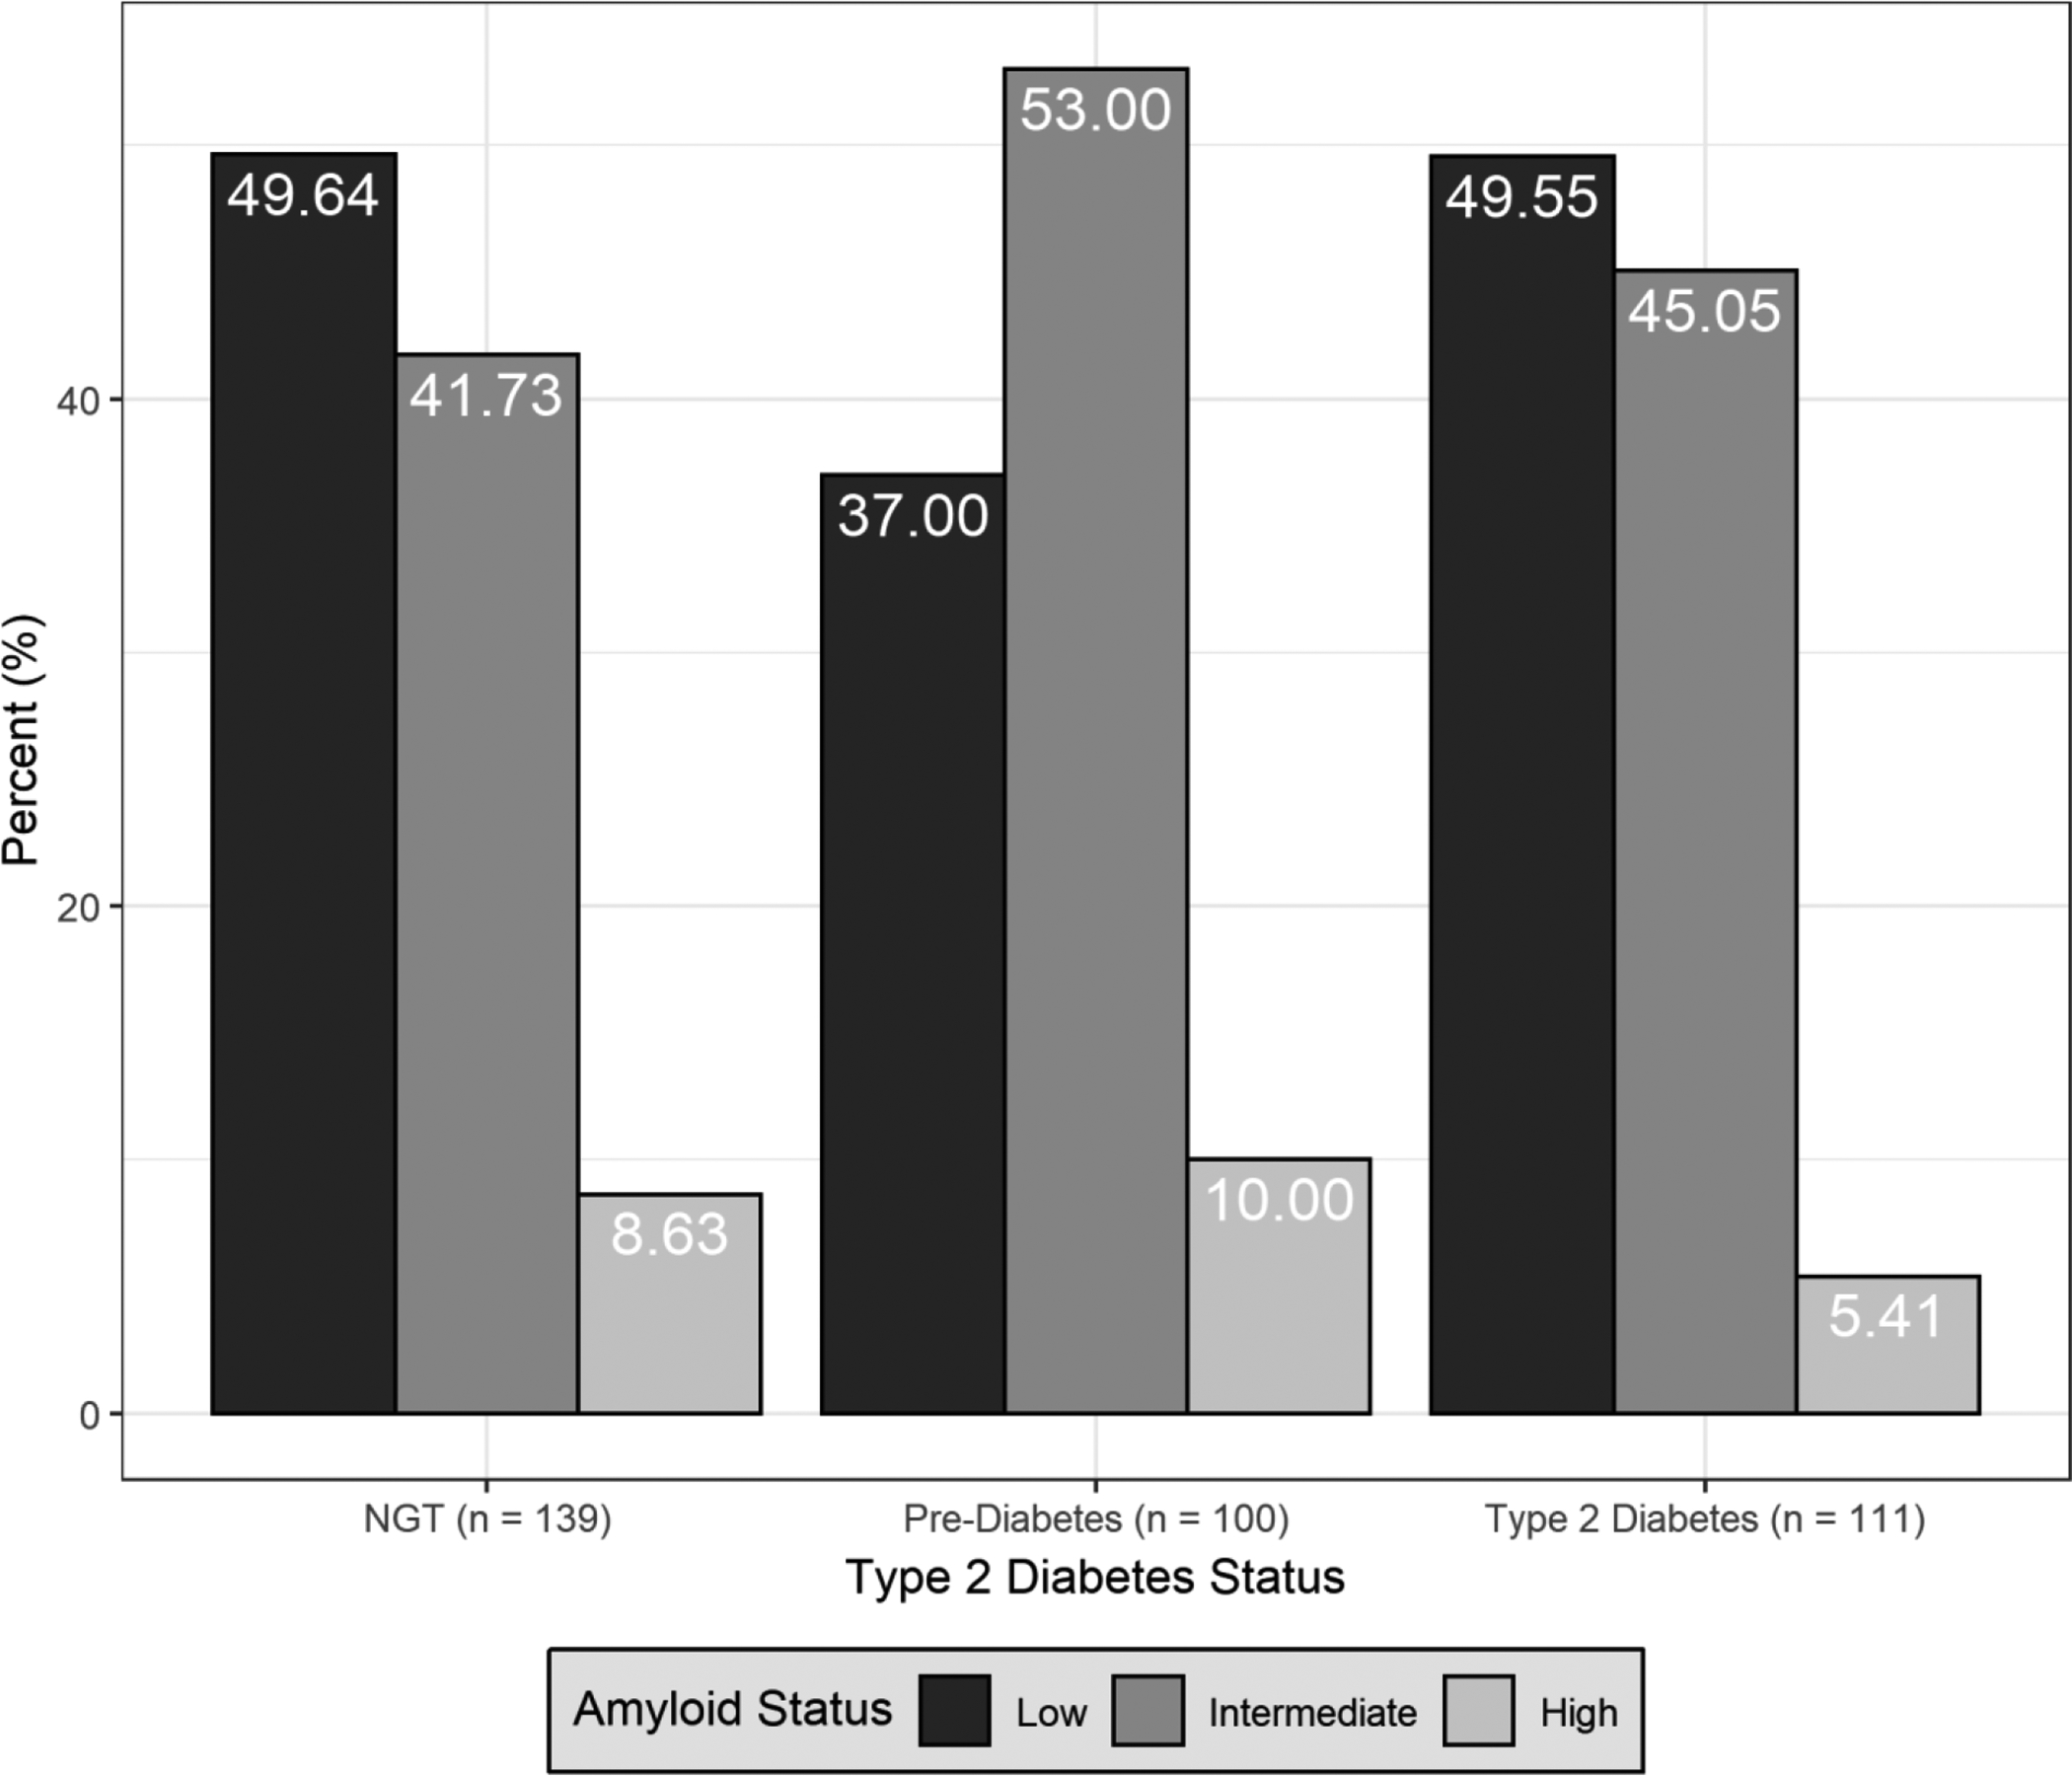
Comparison by type 2 diabetes status (normal glucose tolerance [NGT], pre-diabetes, diabetes), of the proportion of brain amyloid categories (low, intermediate, high).
Official websites use .gov
A
.gov website belongs to an official
government organization in the United States.
Secure .gov websites use HTTPS
A lock (
) or https:// means you've safely
connected to the .gov website. Share sensitive
information only on official, secure websites.
Comparison by type 2 diabetes status (normal glucose tolerance [NGT], pre-diabetes, diabetes), of the proportion of brain amyloid categories (low, intermediate, high).