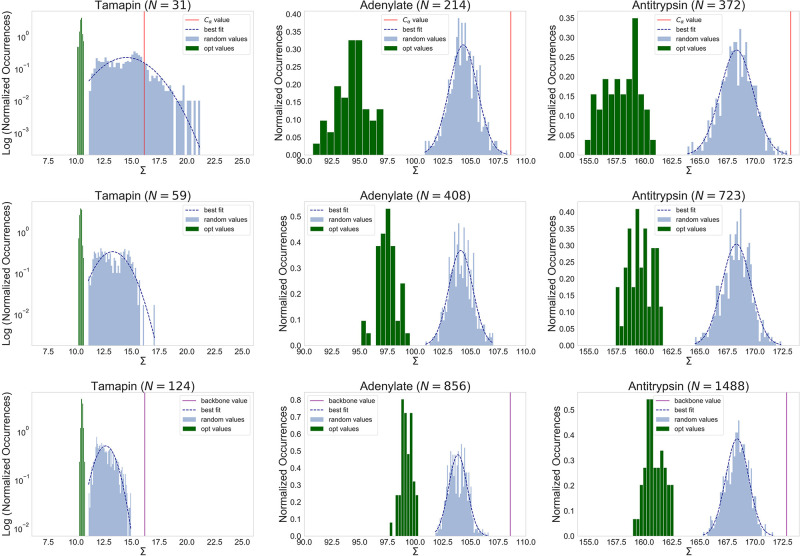
Figure 1.
Distributions of the values of the mapping entropy Σ [in kJ mol–1 K–1] in eq 17 for random mappings (light-blue histograms) and optimized solutions (green histograms). Dark-blue dashed lines show the best fit with normal distributions over the random cases. Each column corresponds to an analyzed protein and each row to a given number N of retained atoms. In the first and last rows, corresponding to numbers of CG sites equal to the numbers of Cα atoms and backbone atoms (Nα and Nbkb, respectively), the values of the mapping entropy associated with the physically intuitive choice of the CG sites (see the text) are indicated by vertical lines (red for N = Nα, purple for N = Nbkb). It should be noted that the σ ranges have the same width in all of the plots.

