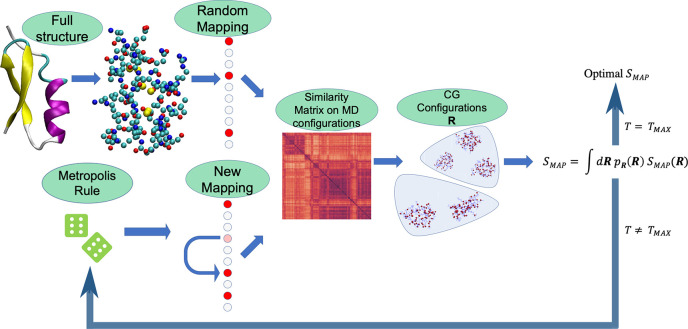
Figure 5.
Schematic representation of the algorithmic procedure described in the text that we employ to minimize the mapping entropy, the latter being calculated by means of eq 25. The full similarity matrix is computed once every TK steps, while in the intermediate steps we resort to the approximation given by eq 23. TK depends on both the protein and N. TMAX is the number of simulated annealing steps (here TMAX = 2 × 10⁴).

