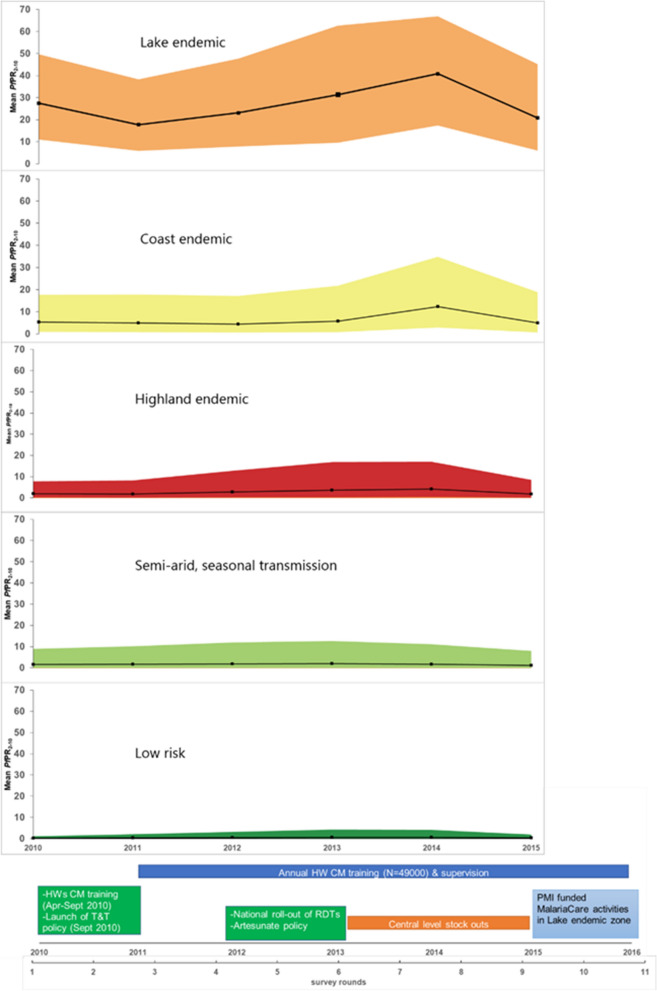
Fig. 2.
The annual mean PfPR2-10 by malaria epidemiological zones and the test-based policy implementation activities, 2010–2016. To characterize the annual malaria parasite prevalence in the five malaria epidemiological zones of Kenya (lake endemic, coast endemic, highland epidemic, semi-arid seasonal transmission and low risk) we used previously published modelling work [36]. In brief, 5020 Plasmodium falciparum parasite prevalence (PfPR) surveys at 3701 communities undertaken in Kenya between 1980 and 2015 were assembled. A spatio-temporal geostatistical model was fitted to predict the annual mean malaria risk and corresponding 2.5–97.5% interquartile credibility range (ICR) for children aged 2–10 years (PfPR2–10) at 1 × 1 km spatial resolution. The model accounted for unmeasured spatio-temporal risk factors (structured random effects) and unexplained variation within communities (unstructured random effects) while standardizing for age. The annual average PfPR2–10 and ICR by zone from 2010 to 2015 was then computed for populated areas where malaria transmission is possible. Areas that do not support malaria transmission were defined based on a temperature suitability index (TSI) (TSI zero areas) constructed using land surface temperatures, the average survival of Anopheles mosquitoes and the length of sporogony that must be completed within the lifetime of one Anopheline generation [41]. Populated areas were defined as locations with at least 1 person per km2 based on population density maps [42] available at Worldpop data geoportal [43]. The annual mean PfPR2-10 in populated areas able to support transmission in each of the five MoH epidemiological zones (Fig. 1) were extracted and mapped using ArcMap 10.5 (ESRI Inc., Redlands, CA, USA) and shown for each year 2010–2015 in Fig. 2, against the major milestones of the policy change and implementation

