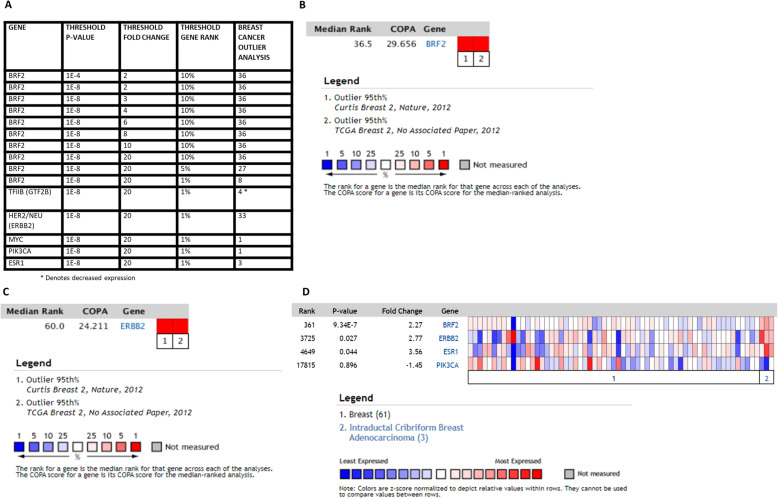
Fig. 4.
Cancer Outlier Profile Analysis (COPA) of BRF2 in breast cancer. Outlier analysis was performed to identify if BRF2 is an outlier in a subset of breast cancer samples using BRF2 gene expression data in Oncomine [21]. a Outlier analysis results for BRF2 in breast cancer using threshold p-value 1E-8, fold change of 20, and gene rank of top 1%. Outlier analysis of 1992 samples from the Curtis Breast 2 [27] and 1602 samples from the TCGA Breast 2 data sets [28, 34, 35] was performed for (b) BRF2 and (c) ERBB2 (HER2) to determine median gene rank and COPA score. (d) Comparison of fold-change in expression of BRF2 and a subset of known biomarkers in breast cancer using the TCGA Breast Cancer Data set [28], n = 593 samples. The data sets analyzed during the current study are available at www.oncomine.org. Queries of Oncomine were performed in September 2019, October 2019, November 2019, January 2020, February 2020, and March 2020

