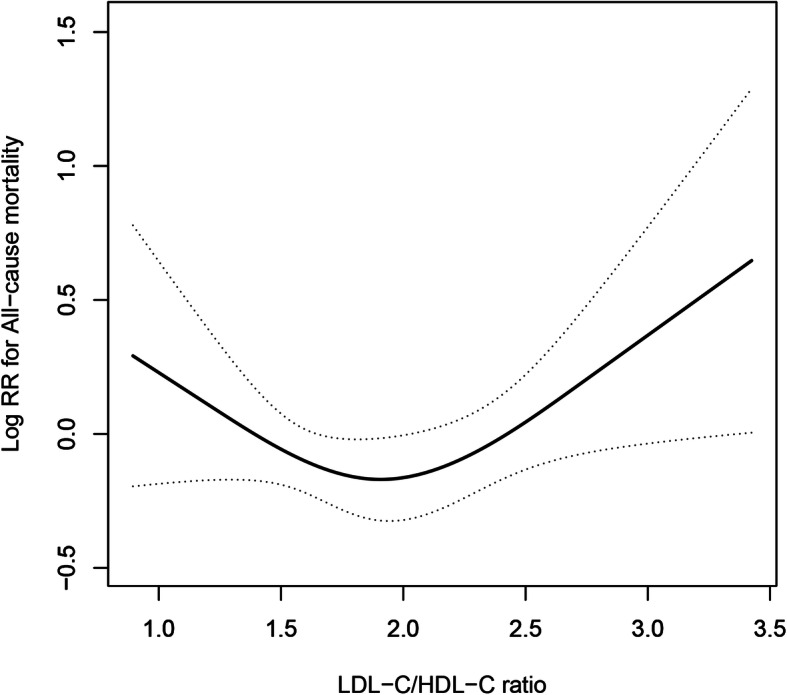
Fig. 1.

Dose-response relationship between the LDL-C/HDL-C and the probability of all-cause mortality. The smooth curve fitting presented a U-shaped relationship between the LDL-C/HDL-C ratio and all-cause mortality. Adjusted for age, sex, BMI, SBP, DBP, TG, Hcy, FBG, SUA, eGFR, smoking, alcohol consumption, diabetes, stroke, CVD and anti-hypertensive drugs
